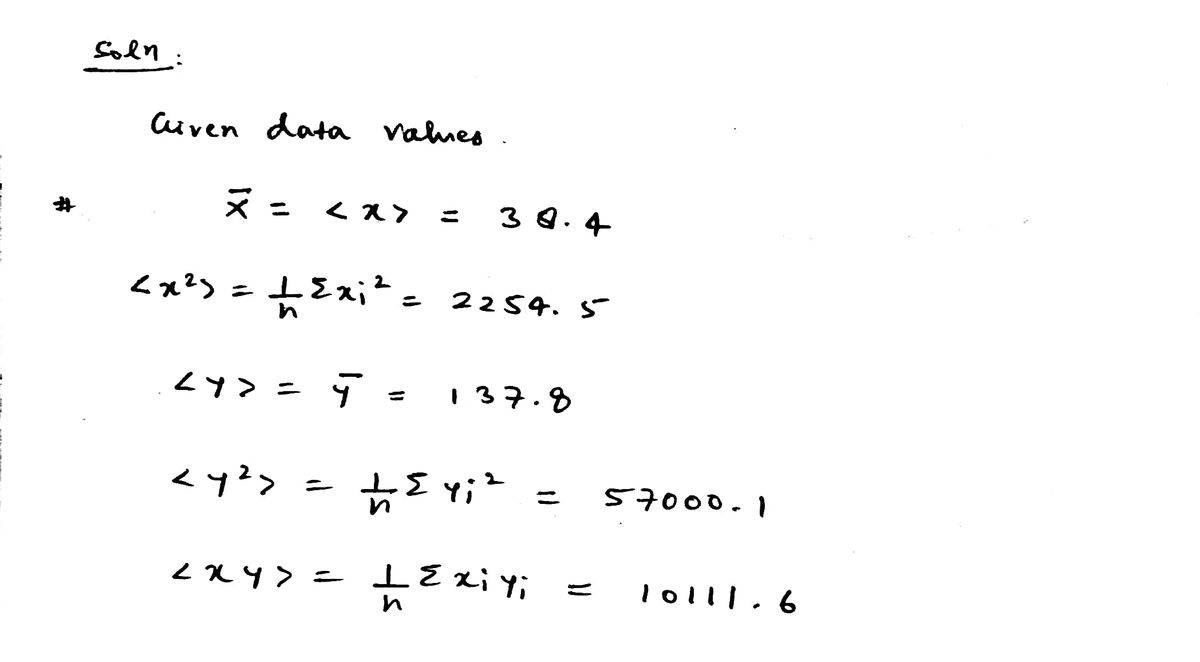
Given the following sets of information, find the linear least squares regression and the correlation coefficient.
Q: As a marketing manager for TriFood, you want to determine whether store Sales (# sold in one month)…
A: Note: Thank you for the question. Since multiple subparts are posted, according to our policy, we…
Q: The least-squares regression equation is y = 660.8x + 15,627 where y is the median income and x is…
A: The regression line is y= 660.8x + 15627 and x= 25.
Q: A regression was run to determine if there Is a relationship between the happiness index (y) and…
A: In multiple linear regression, there will be more than one independent variable. In simple linear…
Q: The table below gives the number of weeks of gestation and the birth weight (in pounds) for a sample…
A: Given information: x y X^2 Y^2 XY 36 4.9 1296 24.01 176.4 37 5.3 1369 28.09 196.1 38 5.8…
Q: Q: The dataset posted below lists a sample of months and the advertising budget (in hundreds of…
A: Introduction: The response variable is the monthly sales ($1000), and the explanatory variables are…
Q: Q2: The following data represent the absences (x) for 7 students in a math course and the final exam…
A: Note: Hey, since there are multiple subparts posted, as per guidelines we will answer first three…
Q: The table below gives the age and bone density for five randomly selected women. Using this data,…
A: Calculate Correlation Coefficient r and coefficient of determination r^2 from the following data…
Q: Required: a. Complete the missing entries from A to H in this output b. Assess the independent…
A: Given, n=25 Let SS be total sum squares Let RSS be sum of squares of residuals let k be the number…
Q: Suppose a doctor measures the height, x, and head circumference, y, of 8 children and obtains the…
A:
Q: Market trader sells mobiles on his stall. He sells the mobiles for a different fixed price, x…
A: From given data, X Y X*Y X*X Y*Y 5 12 60 25 144 2 10 20 4 100 9 15 135 81 225 3 11 33 9…
Q: The table below gives the age and bone density for five randomly selected women. Using this data,…
A: Answer Age Bone Density34 35745 34148 33160 32965 325
Q: The table below gives the age and bone density for five randomly selected women. Using this data,…
A: Age Bone Density 35 350 43 340 53 339 54 321 55 310
Q: D& T LTD marketing team needed more information about the effectiveness of their 3 main mode of…
A: D= SST-SSregr = 174.6631-34.1036 D= 140.5595 Total Observations, n= 25 So .d.f of total, (C)= n-1…
Q: The least-squares regression equation is y=761.7x+13,208 where y is the median income and x is the…
A: Given: x = 26.5% y^=761.7x+13208
Q: X and Y have a negative linear relationship then I. The coefficient of determination is negative.…
A: Hey there.! thank you for posting your question. Hope you're doing well.
Q: The least-squares regression equation is y = 753.6x+ 12,900 where y is the median income and x is…
A:
Q: The table below gives the age and bone density for five randomly selected women. Using this data,…
A: AgeBone Density3933859316603136531266311
Q: Suppose a doctor measures the height, x, and head circumference, y, of 8 children and obtains the…
A: height x27.0025.2526.5025.0027.2526.7525.7527.00head circumference…
Q: The table below gives the age and bone density for five randomly selected women. Using this data,…
A: Given the following table Age 35 43 53 54 55 Bone Density 350 340 339 321 310
Q: The table below gives the number of hours spent unsupervised each day as well as the overall grade…
A: It is given that the predicting the overall grade average(y) for a middle school student based on…
Q: The table below gives the number of hours spent unsupervised each day as well as the overall grade…
A: The given table shows the hours unsupervised and overall grades.
Q: The table contains data on vehicle speed (h) and fuel consumption (lt / 100km) of 5 randomly…
A:
Q: unds, the standard deviation of their heights is 4.16 inches, and the standard deviation of their…
A: The sample size (n) = 500The correlation coefficient, r = 0.52The average height, x̄ = 30.12The…
Q: The accompanying data represent the weights of various domestic cars and their gas mileages in the…
A: Since you have asked multiple questions as per guideline we have solve first Question for you.
Q: The table below gives the number of weeks of gestation and the birth weight (in pounds) for a sample…
A: In the given equation b1 is the slope of the regression line. Data is given, X: 33 35 38 39 41 Y:…
Q: per ge The proportion of the variability in miles per gallon explained by the relation between…
A: Answer:----. Date:----12/10/2021 r = -0.984 So, r^2 = 0.968256
Q: A regression was run to determine if there is a relationship between the happiness index (y) and…
A: Given Y = a+bx a = -1.559 b= 0.133
Q: 1. An experiment was run and the following data table was produced: Input Response 2.5 3 4 4.5 (a)…
A: Using Excel formula “=CORREL(A2:A6,B2:B6)”, the correlation coefficient for the data is obtained as…
Q: Suppose a doctor measures the height, x, and head circumference, y, of 11 children and obtains the…
A: a) In this case, the independent variable is height and the dependent variable is head…
Q: As a marketing manager for TriFood, you want to determine whether store Sales (# sold in one month)…
A: a). R-square interpretation: From the above output, the value of R-square is approximately 0.7577.…
Q: The table below gives the age and bone density for five randomly selected women. Using this data,…
A: Solution: We are given the following data:
Q: The table below gives the age and bone density for five randomly selected women. Using this data,…
A: Answer Given X 37 40 52 60 67Y 352…
Q: When the correlation coefficient (r) is zero, we can say: Choose one: a. the variables are not…
A: Correlation: When a bivariate population is under consideration, there is generally a need to study…
Q: A regression was run to determine if there is a relationship between the happiness index (y) and…
A:
Q: Suppose a doctor measures the height, x, and head circumference, y, of 11 children and obtains the…
A: The correlation coefficient (r)=0.904 we know that, coefficient of determination measure…
Q: 1. The demand and price of a product is given in the following table: Price (Tk.) Demand (kg) 23 35…
A: Hi! Thank you for the question, As per the honour code, we are allowed to answer three sub-parts at…
Q: The table below gives the list price and the number of bids received for five randomly selected…
A: The provided information is as follows:The total number of observations is .The data set is given as…
Q: The least-squares regression equation is y = 689.9x + 14,803 where y is the median income and x is…
A:
Q: The table below gives the age and bone density for five randomly selected women. Using this data,…
A: In multiple linear regression, there will be more than one independent variable. In simple linear…
Q: The least-squares regression equation is y=620.6x+16,624 where y is the median income and x is the…
A: Given: The least-squares regression equation: y=620.6x+16,624 where, y is the median income x is…
Q: The least-squares regression equation is y=761.7x+13,208 where y is the median income and x is the…
A: The least-squares regression equation is y=761.7x+13208 The linear relation between the two…
Q: The least-squares regression equation is y=784.6x+12,431 where y is the median income and x is the…
A: The following regression equation is provided in the question y=784.6x+12,431
Q: The table below gives the completion percentage and interception percentage for five randomly…
A: Since step 1 and 2 were not provided above, i will provide a solution in order to solve this…
Q: For the data given in the table below, find the linear correlation coefficient r and the…
A:
2. d Given the following sets of information, find the linear least squares
Step by step
Solved in 3 steps with 3 images
- The table below gives the age and bone density for five randomly selected women. Using this data, consider the equation of the regression line, yˆ=b0+b1x, for predicting a woman's bone density based on her age. Keep in mind, the correlation coefficient may or may not be statistically significant for the data given. Remember, in practice, it would not be appropriate to use the regression line to make a prediction if the correlation coefficient is not statistically significant. Age 35 43 53 54 55 Bone Density 350 340 339 321 310 Table Step 6 of 6 : Find the value of the coefficient of determination. Round your answerThis is only one questiono pis pe Suppose a doctor measures the height, x, and head circumference, y. of 11 children and obtains the data below. The correlation coefficient is 0.899 and the least squares regression line is y = 0.185x+ 12.276. Complete parts (a) and (b) below. Height, x Head Circumference, y 17.4 17.1 17.2 16.9 17.4 17.1 17.1 17.3 17.3 17.3 17.4 27.75 25.75 26.75 25.75 28 26.5 25.75 26.75 27 27.25 27.25 (a) Compute the coefficient of determination, R?. R2 = % (Round to one decimal place as needed) (b) Interpret the coefficient of determination k Approximately % of the variation in (Round to one decimal place as needed.) is explained by the least-squares regression model. Enter your answer in each of the answer boxes. Save for Later DUE RTTT:DY PIVT Score: o:5SYO Tor Tv attempts 3:35 PA- a 2/22/202 Type here to search insert prt sc 4+ backsp %23 6. 8.
- The table below gives the age and bone density for five randomly selected women. Using this data, consider the equation of the regression line, yˆ=b0+b1x, for predicting a woman's bone density based on her age. Keep in mind, the correlation coefficient may or may not be statistically significant for the data given. Remember, in practice, it would not be appropriate to use the regression line to make a prediction if the correlation coefficient is not statistically significant. Age Bone Density34 35745 34148 33160 32965 325 Step 2 of 6: Find the estimated y-intercept. Round your answer to three decimal places.The table below gives the age and bone density for five randomly selected women. Using this data, consider the equation of the regression line, yˆ=b0+b1x, for predicting a woman's bone density based on her age. Keep in mind, the correlation coefficient may or may not be statistically significant for the data given. Remember, in practice, it would not be appropriate to use the regression line to make a prediction if the correlation coefficient is not statistically significant. Age Bone Density34 35745 34148 33160 32965 325 Step 5 of 6: Determine if the statement "All points predicted by the linear model fall on the same line" is true or false.What does the correlation matrix for a multiple regression analysis contain?A. Multiple correlation coefficientsB. Simple correlation coefficientsC. Multiple coefficients of determinationD. Multiple standard errors of estimate
- The table below gives the age and bone density for five randomly selected women. Using this data, consider the equation of the regression line, yˆ=b0+b1x, for predicting a woman's bone density based on her age. Keep in mind, the correlation coefficient may or may not be statistically significant for the data given. Remember, in practice, it would not be appropriate to use the regression line to make a prediction if the correlation coefficient is not statistically significant. Age 39 43 46 61 64 Bone Density 352 346 321 314 312 Table Step 1 of 6 : Find the estimated slope. Round your answer to three decimal placesConsider the following correlations -0.9 , -0.5 , -0.2 , 0 , 0.2 , 0.5 and 0.9. For each give the fraction of the variation in y that is explained by the least-squares regression of y on x.The least-squares regression equation is y=784.6x+12,431 where y is the median income and x is the percentage of 25 years and older with at least a bachelor's degree in the region. The scatter diagram indicates a linear relation between the two variables with a correlation coefficient of 0.7962. In a particular region, 26.5 percent of adults 25 years and older have at least a bachelor's degree. The median income in this region is $29,889. Is this income higher or lower than what you would expect? Why?
- The least-squares regression equation is y=620.6x+16,624 where y is the median income and x is the percentage of 25 years and older with at least a bachelor's degree in the region. The scatter diagram indicates a linear relation between the two variables with a correlation coefficient of 0.7004. Predict the median income of a region in which 30% of adults 25 years and older have at least a bachelor's degree.A regression was run to determine if there is a relationship between the happiness index (y) and life expectancy in years of a given country (x). The results of the regression were: ý=a+bx a=-1.692 b=0.117 (a) Write the equation of the Least Squares Regression line of the form (b) Which is a possible value for the correlation coefficient, r? O -0.649 O 1.32 O 0.649 O-1.32 (c) If a country increases its life expectancy, the happiness index will O increase O decrease (d) If the life expectancy is increased by 2.5 years in a certain country, how much will the happiness index change? Round to two decimal places. (e) Use the regression line to predict the happiness index of a country with a life expectancy of 75 years. Round to two decimal places.5