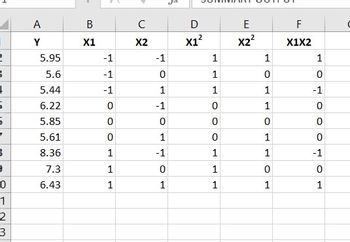
Q1: The data points below are related to a chemi-thermo-mechanical pulp from mixed density hardwoods. They relate Y (specific surface area of the fibres in cm/g) to the % NaOH (sodium hydroxide) used as a pretreatment chemical and the treatment time (min) for different batches of pulp. The variables are present at three different levels. In this case, it is preferred (for reasons that we will discuss later in the course) to code the levels as shown in the last two columns of the table below, designated by Xı and X2. Y SODIUM TIME Xi X2 HYDROXIDE 5.95 3 30 -1 -1 5.60 3 60 -1 5.44 3 90 -1 1 6.22 9. 30 -1 5.85 60 5.61 9. 90 1 8.36 15 30 1 -1 7.30 15 60 6.43 15 90 1 1 a. Using the variables Y, X1 and X2 (not actual time and sodium hydroxide! You will see why later!), fit the following multiple linear regression model to the data: (Model A) Y = (b0) + (b1) X1 + (b2) X2; subsequently, estimate the parameters and examine the residual plot (residuals vs Y hat). What does this residual plot tell you about the adequacy of this model (model A)? b. Now fit the following model: (Model B) Y = (bo0) + (bi) X1 + (b2) X2 + (b3) (X1) + (ba) (X2)² + (bs) X1 X2 Can one or more terms be dropped to simplify this model (model B)? (Hint: One might do hypothesis tests on individual parameters). Employing now the new model version (model C) (if you decided to drop any terms earlier), use the residual plot (residuals vs Y hat) to check your analysis. Is the normality assumption a good one here? Next, determine the ANOVA table (with model C, if you decided to drop any terms earlier). What is the estimate of the variance of the error affecting the Y data (i.e., estimate of the error on your Y data)? Calculate the parameter variance-covariance matrix and the parameter correlation matrix (you should be able to construct the parameter correlation matrix based on material covered between CH 2 and the last parts of CH 1). Would you have any concerns?
Minimization
In mathematics, traditional optimization problems are typically expressed in terms of minimization. When we talk about minimizing or maximizing a function, we refer to the maximum and minimum possible values of that function. This can be expressed in terms of global or local range. The definition of minimization in the thesaurus is the process of reducing something to a small amount, value, or position. Minimization (noun) is an instance of belittling or disparagement.
Maxima and Minima
The extreme points of a function are the maximum and the minimum points of the function. A maximum is attained when the function takes the maximum value and a minimum is attained when the function takes the minimum value.
Derivatives
A derivative means a change. Geometrically it can be represented as a line with some steepness. Imagine climbing a mountain which is very steep and 500 meters high. Is it easier to climb? Definitely not! Suppose walking on the road for 500 meters. Which one would be easier? Walking on the road would be much easier than climbing a mountain.
Concavity
In calculus, concavity is a descriptor of mathematics that tells about the shape of the graph. It is the parameter that helps to estimate the maximum and minimum value of any of the functions and the concave nature using the graphical method. We use the first derivative test and second derivative test to understand the concave behavior of the function.

Step by step
Solved in 4 steps with 6 images

Thank you so much for answering my previous question. Could you help me with one more thing? Could you give me the table you have put for regression for Model C? I tried with this one, but not getting my answers... I have attached my table below.
Thanks in advance!

Could you answer this?
Next, determine the ANOVA table (with model C, if you decided to drop any terms earlier). What is the estimate of the variance of the error affecting the Y data (i.e., estimate of the error on your Y data)? Calculate the parameter variance-


