What is your conclusion regarding Ho? Ho. There sufficient evidence at the x = 0.05 level of significance to conclude that the clarity of the lake is improving.
What is your conclusion regarding Ho? Ho. There sufficient evidence at the x = 0.05 level of significance to conclude that the clarity of the lake is improving.

MATLAB: An Introduction with Applications
6th Edition
ISBN:9781119256830
Author:Amos Gilat
Publisher:Amos Gilat
Chapter1: Starting With Matlab
Section: Chapter Questions
Problem 1P

Related questions
Question
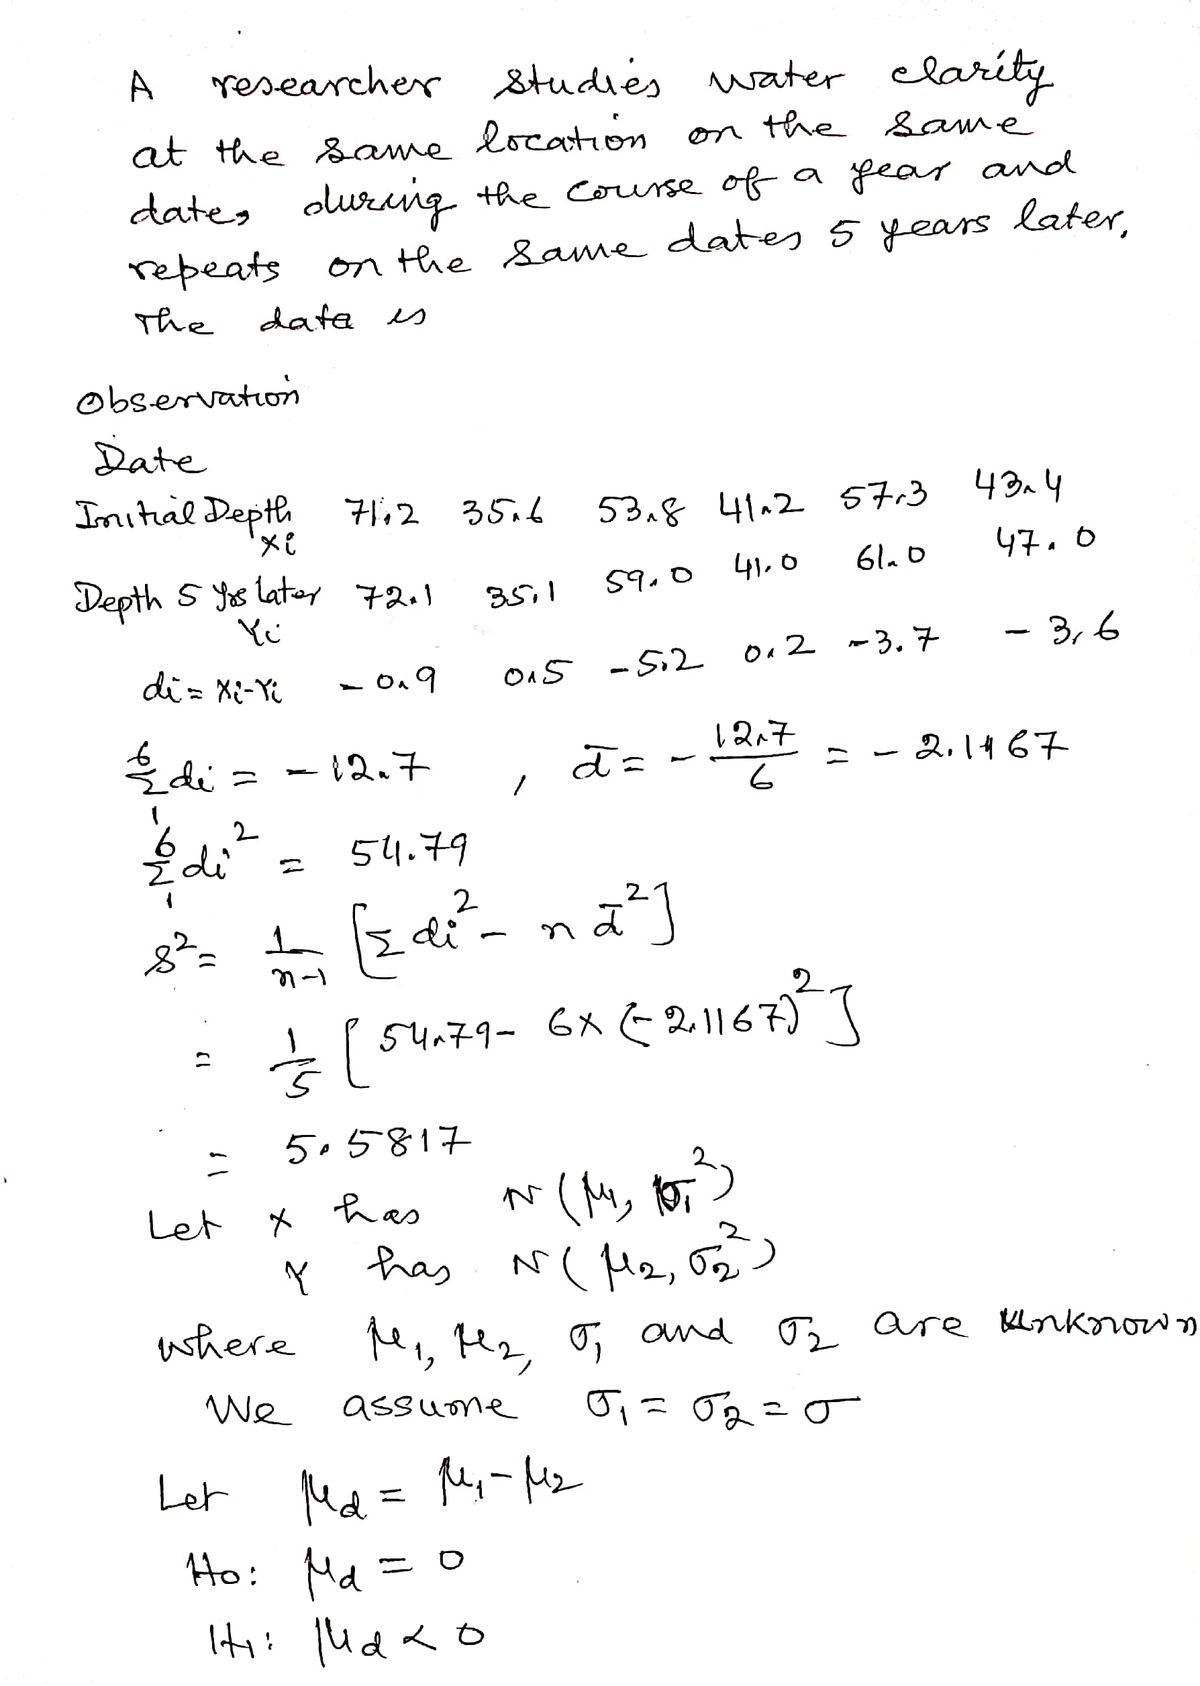
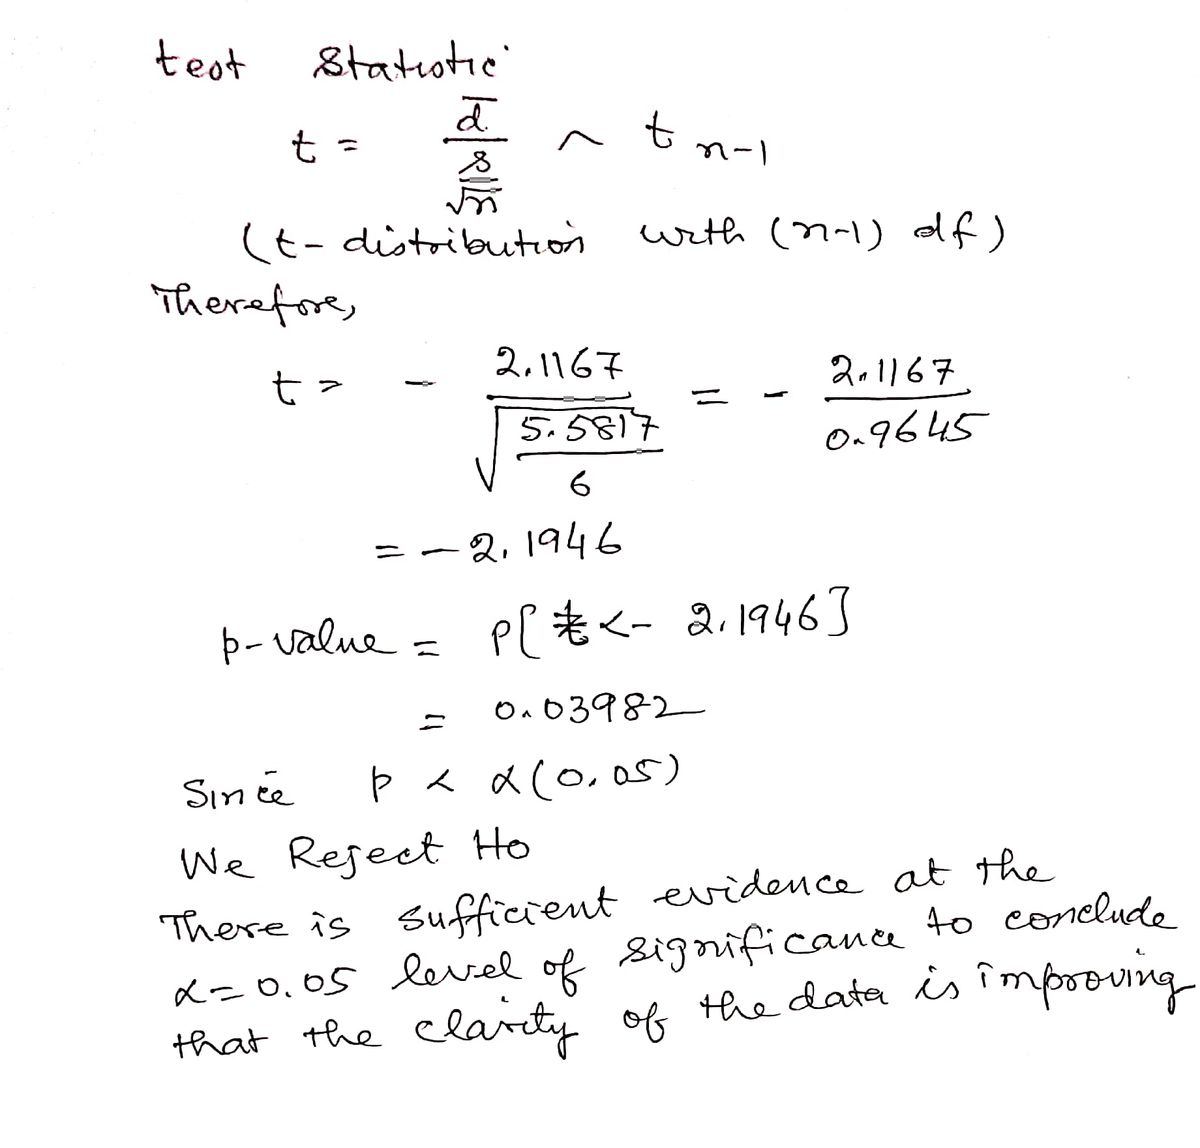
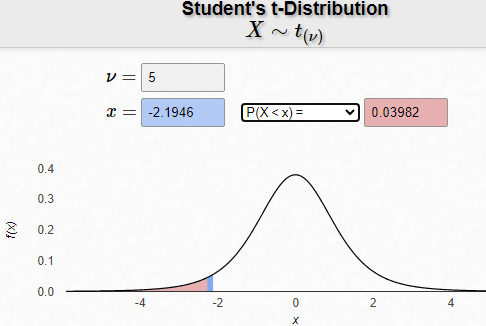
![**Conclusion Regarding the Null Hypothesis (H₀):**
- H₀: There is [choose appropriate option] sufficient evidence at the α = 0.05 level of significance to conclude that the clarity of the lake is improving.
This statement refers to the conclusion drawn from a statistical hypothesis test. In hypothesis testing, the null hypothesis (H₀) is a default statement that there is no effect or no difference. The goal of the test is to determine whether there is enough evidence to reject this null hypothesis in favor of an alternative hypothesis. Here, the test is conducted at a 0.05 level of significance, which is a common threshold for determining statistical significance.](/v2/_next/image?url=https%3A%2F%2Fcontent.bartleby.com%2Fqna-images%2Fquestion%2Fac3be618-b645-4bd8-855b-808ff3fc18d4%2F06156cdf-f590-4e08-ae8b-8763805b37b3%2Fcozq6mt_processed.jpeg&w=3840&q=75)
Transcribed Image Text:**Conclusion Regarding the Null Hypothesis (H₀):**
- H₀: There is [choose appropriate option] sufficient evidence at the α = 0.05 level of significance to conclude that the clarity of the lake is improving.
This statement refers to the conclusion drawn from a statistical hypothesis test. In hypothesis testing, the null hypothesis (H₀) is a default statement that there is no effect or no difference. The goal of the test is to determine whether there is enough evidence to reject this null hypothesis in favor of an alternative hypothesis. Here, the test is conducted at a 0.05 level of significance, which is a common threshold for determining statistical significance.
Expert Solution
Step 1: Testing of hypothesis.

Step by step
Solved in 3 steps with 5 images

Recommended textbooks for you
MATLAB: An Introduction with Applications
Statistics
ISBN:
9781119256830
Author:
Amos Gilat
Publisher:
John Wiley & Sons Inc

Probability and Statistics for Engineering and th…
Statistics
ISBN:
9781305251809
Author:
Jay L. Devore
Publisher:
Cengage Learning

Statistics for The Behavioral Sciences (MindTap C…
Statistics
ISBN:
9781305504912
Author:
Frederick J Gravetter, Larry B. Wallnau
Publisher:
Cengage Learning
MATLAB: An Introduction with Applications
Statistics
ISBN:
9781119256830
Author:
Amos Gilat
Publisher:
John Wiley & Sons Inc
Probability and Statistics for Engineering and th…
Statistics
ISBN:
9781305251809
Author:
Jay L. Devore
Publisher:
Cengage Learning
Statistics for The Behavioral Sciences (MindTap C…
Statistics
ISBN:
9781305504912
Author:
Frederick J Gravetter, Larry B. Wallnau
Publisher:
Cengage Learning

Elementary Statistics: Picturing the World (7th E…
Statistics
ISBN:
9780134683416
Author:
Ron Larson, Betsy Farber
Publisher:
PEARSON

The Basic Practice of Statistics
Statistics
ISBN:
9781319042578
Author:
David S. Moore, William I. Notz, Michael A. Fligner
Publisher:
W. H. Freeman

Introduction to the Practice of Statistics
Statistics
ISBN:
9781319013387
Author:
David S. Moore, George P. McCabe, Bruce A. Craig
Publisher:
W. H. Freeman