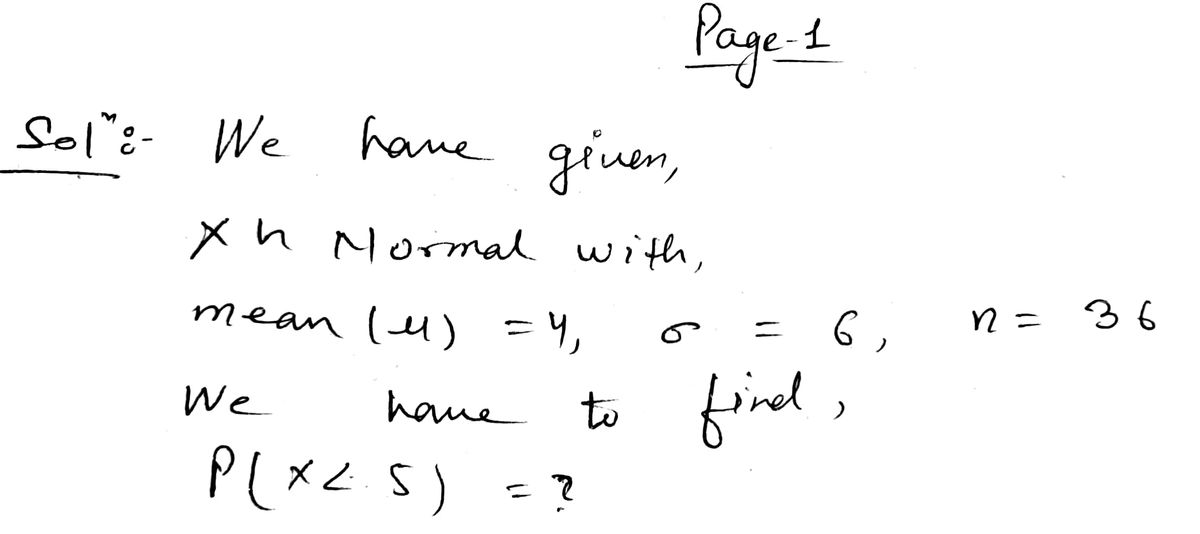
For X~normal with = 4,0 = 6 and a sample size of 36, P(X < 5) = Note: round your z score to two decimals places 00.4325. 00.8413. 00.1587. 0.5675. O none of the above. Submit Question


Q: The distribution of bachelor's degrees conferred by a university is listed. Assume that a student…
A: The frequency distribution is given as, Major Frequency Physics 216 Philosophy 207…
Q: 17. A variable distributes normally in the population, with a mean of u=1000 and a standard…
A: Let X~ N(1000, 1202) Then,Z=X-1000120~N(0,1) a.)…
Q: 21. The amount of trash generated by US households (in lbs per day) is Normally distributed. You a…
A: Given that Sample size n =8 Sample mean =10 Sample standard deviation =5
Q: What sample size is needed to give a margin of error within ±5% in estimating a population…
A: Here we need to find the required sample size. Since no preliminary estimate is given we take sample…
Q: What is the Margin of Error, E?
A: Since the sample size is small and population SD is unknown then we will use critical value based on…
Q: Find the indicated IQ score. The graph to the right depicts IQ scores of adults, and those scores…
A: X follows a Normal distribution with mean = 100 and S.D = 15 Then z=(x-mean)/SD = (x-100)/15…
Q: Suppose this test is given to a very large group of people. Use the empirical scores are between 55…
A: On a certain test, the mean is 95 with a standard deviation of 20. The results come very close to…
Q: Score: 0 of 1 pt 7.1.27 The graph of a normal curve is given. Use the graph to identify the value of…
A:
Q: For a normal population with a mean of u = 60 and a standard deviation of o=12, what is the…
A: Mean : µ = 60 Standard deviation : σ = 12 M = 45 n = 4 We have to calculate : Sample mean is greater…
Q: 1. The table below gives process times for two different systems running a series of computation…
A: there are some mistakes , no worries i will work them out for you mistake are happened because you…
Q: Find the Z-score that describes the following proportions under the normal curve (within 0.01…
A: We have given that, Z from the normal distribution with top 75% of scores then we will find the Z-…
Q: 1. From a sample of 230 pet owners, 104 indicate that they buy their pet food in brick-and-mortar…
A: Sample size Number of pet owners who buy their pet food in brick and mortar storms is
Q: Please only answer if you can answer only D, E, F, and G. Answer these parts correctly. I have a…
A: Answer:----. Date:----30/09/2021 Hai you mentioned solve D,E,F,G subparts I solved all…
Q: Find the standardized test statistic t for a sample with n= 10, x 16.8, s 1.3, and a= 0.05 if Ho: u…
A: We have given that Sample size n=10 Sample mean = 16.8 Sample standard deviation =1.3
Q: Suppose we have 3 groups of data with sample sizes of 10, 12, and 15 respectively. Complete the…
A: Use the given table and the given values to calculate the unknown values in the ANOVA table.Given:…
Q: A sample of 50 lenses used in eyeglasses yields a sample mean thickness of 3.05 mm and a sample…
A: Denote μ as the true average thickness of lenses.
Q: this data has a mean of 7.2 . 5, 7, 9, 10, 5 Calculate the sample standard deviation of this…
A: Central tendency measures the central value of the data set. Mean is a measure of central tendency.…
Q: Find the percent of the total area under the standard normal curve between the following pair of…
A:
Q: (c) At 95% confidence, what is the margin of error? (Round your answer to one decimal place.) X (d)…
A: ( c )To find margin of error using the formulaE=(t-critical)At L.O.S,df = 42,t-critical value…
Q: find the are under the normal curve between Z-scores of -0.56 1.07 -2.53 2.05 show and explain…
A:
Q: Resistors for use in a certain application are Supposed to have a mean resistance M greater than…
A: Given Information: The hypothesized value of the population mean is 100 The population standard…
Q: shown below are among the results obtained in the study. Higher scores correspond to greater pain…
A:
Q: Assume that adults have IQ scores that are normally distributed with a mean of 100.1 and a standard…
A: Given,Mean (μ) = 100.1and standard deviation (σ) = 22.2
Q: Right tail test with Zcalc = 1.07. What is the p-value of the test?
A: Given information- The value of test statistics, z = 1.07 We have to find the p-value for a…
Q: the heights of male adults are normally distributed with mean 1.7m and standards deviation 0.2m In a…
A: The normal distribution in the center are generally denser and basically less denser at tails. There…
Q: If you want to be 95% confident of estimating the population mean to within a sampling error of +35…
A:
Q: Please help, I keep getting the p-value wrong as it is supposed to be 0.00000. I need help finding…
A:
Q: Let : fl be the population mean of a certain population. In testing Ho μ = 2.4 versus H₁ : µ ‡ 2.4,…
A:
Q: Please count it manually without using excel so I can learn how to calculate it 3. A landlord is the…
A: ANOVA: The analysis of variance (ANOVA) is used to determine whether there are any statistically…
Q: The average number of people who attend a soccer game at the Salt Lake Stadium in West Bengal, India…
A: Hi, we are supposed to answer three subparts a time. Since you have not mentioned which subpart to…
Q: Question 1 The average height of students in a freshman class ofa certain school has been 153.24 cm…
A:
Q: Please count it manually without using excel so I can learn how to calculate it 3. A landlord is the…
A: Given Information : A landlord is the owner of an apartment decides to build new rooms for ensuit ,…
Q: Find the percentage of the area under a normal curve between the mean and the given number of…
A: Z- value can be calculated as, Z=χ-μσ We have to find area under normal curve between the mean and…
Q: Step 3 of 7: What is the Lower Control Limit? Round your answer to three decimal places.
A: The data along with sample mean and ranges of 12 time periods is given below.Here subgroup size
Q: lustration 17.25. The income distribution of a group of 10,000 persons was found to be normal with…
A:
Q: Find the indicated IQ score. The graph to the right depicts IQ scores of adults, and those scores…
A: The z-score:The z-score of a normally distributed random variable, X, with mean μ and standard…
Q: Illustration 10.44. A calculating machine.while calculating mean and standard deviation of 25…
A: n=25, σ=5, x̄=30
Q: Look at the attached images. Explain and analyse for INR group A and B.
A: Given contents are Normal plot and Box plot. We'll discuss it in detail. Normal Q-Q plot: It is a…
Q: 1. A random sample of Californians has a mean age of 34.4, but you want to know the mean age of all…
A: Given problems related to basic statistics, we have to solve all the problems.
Q: Find the standardized test statistic t for a sample with n= 15, x = 10.4, s 0.8, and a= 0.05 if Ho:…
A: Given,n=15x¯=10.4s=0.8α=0.05H0:μ≤10.1
Q: Assume the samples are random and independent, the populations are nomally distributed, and the…
A: Since you have posted a question with multiple sub-parts, we will solve first three sub- parts for…
Q: H0: μ ≤ 16.09 vs. HA: μ > 16.09 What is the test statistic for sample of size 25, mean 13.97, and…
A:


Step by step
Solved in 2 steps with 2 images

- A normal distribution with a mean of 2mm and a standard deviation of 0.05mm a randomly generated number of 0.71 , need to calculate the standardised Z value, from my notes Z = (actual value - mean)/standard deviation. do i take the randomly generated number of 0.81 as the actual value ?Please give me correct solution and explain.The chi-square statistic for these data is x = 8.134. Which of the following intervals contains the P- value for this test? Color preference Pink Blue Yellow Green Total Female 48 24 18 30 120 Gender Male 55 34 18 116 Total 103 58 27 48 236 0.025 0.1
- The glucose readings are 95, 86, 84, 107, 101, 112,85,86. The sample mean is 94.8, it is a normal distribution wirh the standard devian is 12.5, and the mean glucose is 85. Do these data indicate that Ben has an overall average level higher than 85? Use a=0.05, what is the level of significance? Compute z value of the sample test statistic. Find p valueThis Is A REVIEW! Please help and show work on paperyou want to obtain a sample to esimate a population proportion. Based on previous evidence, you believe the population standard devition is approximately 65.5. You would like to be 99% confident that your estimate is within 1 of the true population mean. How large of a sample size is required? Do not round mid calculation. Use a critical value rounded to three decimal places.
- Find the percentage of the total area under the standard normal curve between the following z-scores. z=1.44 and z=2.83 Click here for page 1 of the Areas under the Normal Curve Table Click here for page 2 of the Areas under the Normal Curve Table The percentage of the total area between z=1 44 and z=2.83 is% (Round to two decimal places as needed.)A distribution of values is normal with a mean of 41.2 and a standard deviation of 24.2. Find P38, which is the score separating the bottom 38% from the top 62%. P38 = Enter your answer as a number accurate to 1 decimal place. Answers obtained using exact z-scores or z-scores rounded to 3 decimal places are accepted. Submit Question abc esc F1 F2 F3 F4 F5 F6 %23 3. Q W R 45400 A simple random sample of six values had mean x = 13.00 and standard deviation s = 7.155, Calculate the standard error of %3D the sample mean, s7. Give your answer to three decimal places. 2.92 ='s Incorrect MacBook Pro & K B.
