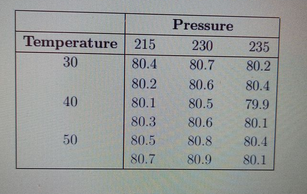
Example 6.2.1 In a chemical process the most important variables that are thought to affect the yield are pressure and temperature. Three levels of each factor are selected and a factorial erperiment in a CRD with two replications was performed. The results are as shown in table 6.2.1. Analyse the data and draw conclusions. Pressure Temperature 215 230 235 30 80.4 80.7 80.2 80.2 80.6 80.4 40 80.1 80.5 79.9 80.3 80 6 80 1
Q: Number 14 parts d and e.
A: From the given Histogram, let us consider the following frequency table,
Q: Consider an experiment to study the effect of six samples (A, B, C, D, E, F) of a fertilizer on…
A: Given that Number effect = k = 6 Total observation = n = 20*6 = 120
Q: An ecologist is considering two different positions in which to setup his solar energy collector. He…
A: X is the measure of energy in position X Y is the measure of energy in position Y The values of X…
Q: b-1. Calculate the value of the test statistic. Assume that o,2 = 4.4 and Og² = 5.2. (Negative…
A: Obtain the value of mean for Brand A The value of mean is obtained below as follows: Use EXCEL…
Q: Caffeine: Following are the number of grams of carbohydrates in 12-ounce espresso beverages offered…
A: The given data is, Sr No…
Q: Q4 As a factory manager, you are concem about the health of your workers. In this regard, you have…
A: Q4. Let x be the working temperature and y be the water consumption. The scatter plot is obtained…
Q: Energy consumption is claimed to be a good predictor of Gross National Product. An economist…
A: (VII) Use EXCEL to determine the coefficient of determination. EXCEL procedure: Go to EXCEL…
Q: A scientist wishes to investigate whether exposure to sunlight reduces the amount of time it takes…
A: To investigate whether exposure to sunlight reduces the amount of time it takes for a particular…
Q: Caffeine: Following are the number of grams of carbohydrates in 12-ounce espresso beverages offered…
A: 24,20,26,18,16,10,13,14,14,21,35,30,32,34,27,37,37,49,43,41,40,39,47,45,37sample size(n)=25Arrange…
Q: 8. The graph to the right compares Albacore and Light tuna's mercury content in parts per millions…
A: Box plot is used to understand the spread of data from the mean. This graph is also known as…
Q: Round your answers to 2 decimal places. (a) Fit a simple linear regression model to the data. Test…
A:
Q: How to work this problem 12.4
A:
Q: A consumer advocate researches the length of life between two brands of refrigerators, Brand A and…
A: From the information, given thatLet µ1 denotes the mean longetivity for Brand ALet µ2 denotes the…
Q: delirium; survival time for people in both groups was at most 6 hours. The accompanying data was…
A: EDNon-ED000000000.100.10.10.10.10.10.10.20.10.20.20.30.20.30.20.30.30.40.30.50.30.70.40.80.510.51.40…
Q: A researcher is interested in determining if there's a difference in body fat percentage between…
A: Part 1: The body fat percentage between athletes who had a high protein diet compared to those who…
Q: Example: Jenny bought 24 Christmas balls for her mini-Christmas tree. From the statistical table…
A: Given table :
Q: Energy consumption is claimed to be a good predictor of Gross National Product. An economist…
A: The data shows the energy consumption (x) and gross national product (y).
Q: Number of Facilities Number 9 11 16 21 27 30 Average Distance (miles) 1.67 1.11 0.83 0.63 0.52 0.46…
A: Number of Facilities Average Distance 9 1.67 11 1.11 16 0.83 21 0.63 27 0.52 30 0.46…
Q: Let μ1 represent the mean emission at 40°F and =μd−μ1μ2. Can you conclude that the mean emission…
A: The hypothesis is, Null hypothesis: H0:μd=0 Alternative hypothesis: H1:μd≠0 The difference is,…
Q: Solve the following questions (No software plot or solution): a) the significant factors if any.…
A: (a) There is a significant main effect of Temperature. (F = 11.99, p = 0.005 < 0.05) Analysis of…
Q: 13. Valley View Hospital (August data): Autopsies IP: Clinical Unit Adm. Disch Deaths НР No Cor…
A:
Q: The data show the number of hours of television watched per day by a sample of 28 people. Use…
A: Given data, 5,4,2,9,3,0,0,3,8,1,8,6,0,9,4,3,0,8,2,0,5,7,0,9,6,4,7,9 Sort the given data in…
Q: Truck Pollution: In an experiment to determine the effect of ambient temperature on the emissions of…
A: The data shows that emissions, in parts per billion for ten trucks.
Q: A researcher wanted to determine if carpeted rooms contain more bacteria than uncarpeted rooms. The…
A: Given Information: Carpeted: Sample size (n1) = 8 Uncarpeted: Sample size (n2) = 8 Calculate mean…
Q: 11.1.15Infrared Radiation Readings The data set in DS 11.1.3 concerns the infrared radiation…
A: Mild Medium Severe 1.35 1.31 1.43 1.37 1.33 1.36 1.34 1.47 1.43 1.38 1.26 1.31 1.35 1.43…
Q: The table below shows some data on which countries are major oil produc- ers and which countries…
A: Given 2x2 table is:Civil warNo civil warTotalOil producer71219Non-oil producer5594149
Q: A study was made on the amount of converted sugar in a certain process at various temperatures. The…
A: Given data is as follows Temperature, x Converted sugar, y 1.0 8.1 1.1 8.8 1.2 8.5 1.3…
Q: y data was taken with the view to testing the model: ES-a+BAGE+YMIL+SENG e SALES= amount that a…
A: (a) The dependent variable is sales. The independent variables are AGE,MIL and ENG. (b) The…
Q: A state's park system statistical report for the 2014/2015 fiscal year gave the accompanying data on…
A: Given: n = 9 Formula Used: The equation of the least squares line is: Y = a + bX b =…
Q: Correct answer plz
A:
Q: Using a ANOVA, A) What is the SStrt for the ANOVA? Give your answer to at least three decimal…
A: Solution:
Q: High Cholesterol: A group of eight individuals with high cholesterol levels were given a new drug…
A:
Q: Screen tension A manufacturer of high-resolution video terminals must control the tension on the…
A: From the given information, samples mean SD 300 306.673 7.734 Let α=0.05. α2=0.052=0.025…
Q: An ecologist is considering two different positions in which to setup his solar energy collector. He…
A: from given data
Q: Bivariate data often arises from the use of two different techniques to measure the same quantity.…
A: In this case, x defines the hydrogen concentration using a gas chromatography method and y defines…
Q: king distances (in feet) when stopping on a dry surface are shown in the conclude that there is a…
A: n=6, α=0.05
Q: Mercury Levels in Fish Figure 4.25 shows a scatterplot of the acidity (pH) for a sample of n = 53…
A: a. Testing the significance of correlation coefficient: The test hypotheses are provided below: Null…
Q: The ages (X) of ten second-hand cars and their km values (Y) are given below. a) Calculate the…
A: Data given X: 3.3, 5.8,3,4.5,1.8,3.9,2 Y:35,60,21,55,34,45,2
Q: 10. A national survey is conducted to assess the association between hypertension and stroke in…
A: Given, A national survey is conducted to assess the association between hypertension and stroke in…
Q: Choose the correct answer. Which statement is true? a. Secondary data are generated by an individual…
A: The primary data is the data which is generally collected by the researchers from first hand…
Q: Which of the following is the dependent variable in an experiment studying the effect of rainfall on…
A: Dependent variable: The variable changes or affected by other variables is known as dependent…
Q: Construct a scatter diagram using the data table to the right. This data is from a study comparing…
A: a) Constructing scatter diagram using excel
Q: Ten samples of two dimensional data set is given in the table. Find the principal components of this…
A: Given data of ten sample of the two-dimensional set is as follows, X 1.4 1.6 -1.4 -2.0 -3.0 2.4…
Given :
Step by step
Solved in 4 steps with 3 images
- You are asked to determine whether laptop brand A charges a higher premium for its laptops than brand B. You observe a sample of six laptops, their prices and brand. You observe a performance benchmark x for each of the laptops. Let (yi, xi) denote the price and performance of laptop i. Your data are: Obs. i=1 i = 2 i = 3 i = 4 i = 5 i = 6 Brand Price A $1000 A $1500 A B B B $2000 $1500 $2000 $2500 Performance 1 2 3 3 4 5 Draw a scatter plot of price vs. performance. Which brand produces more expensive laptops on average in the sample? Would you say this brand charges a higher premium? Explain by writing down an appropriate regression model, estimation results and an intepretation of your results. If you omit brand information from your regression and just regress price on performance, are you likely to over or under-estimate the association between performance and price? Explain by determining the likely sign of the omitted variables bias as in lecture and comparing it with the…5 and 6. The following data was collected from 1 bag of Hershey Kisses®. Each Kiss® was weighed in grams with the wrapper and recorded in the table below. Hershey claims that there are 368 grams of chocolate in one bag. Hershey Kiss Weights in Grams 4.76 4.72 4.74 4.55 4.91 4.74 4.78 4.71 4.80 4.78 4.78 4.75 4.79 4.82 4.91 4.83 4.68 4.74 4.70 4.80 4.70 4.76 4.70 4.83 4.93 4.74 4.84 4.82 4.76 4.77 4.72 4.78 4.83 4.75 4.74 4.68 4.84 4.71 4.71 4.76 4.66 4.78 4.73 4.74 4.92 4.77 4.80 4.79 4.86 4.64 4.78 4.70 4.75 4.78 4.76 4.83 4.66 4.77 4.83 4.78 4.69 4.81 4.68 4.78 4.88 4.72 4.85 4.85 4.81 4.74 4.80 4.82 4.84 4.70 4.85 4.70 4.81 4.72 4.79 4.73 4.61 Based on Hershey's® claim for 368 total net grams of chocolate in the bag, approximately how many Kisses® too many or too few are there? Assume that the Kisses® were weighed with the wrapper, each wrapper weighs 0.12 grams, and the net grams listed on the bag are for the chocolate only. Give some possible…Blood pressure: A blood pressure measurement consists of two numbers: the systolic pressure, which is the maximum pressure taken when the heart is contracting, and the diastolic pressure, which is the minimum pressure taken at the beginning of the heartbeat. Blood pressures were measured, in millimeters, for a sample of 6 adults. The following table presents the results. Systolic Diastolic 130 116 133 112 134 107 Part: 0 / 4 76 Part 1 of 4 70 91 Critical value(s): 75 Send data to Excel 87 The least-squares regression line y = b + b₁ x= 4.4261 +0.6058x and (x-x)² = 690.0000 are known for this data. Use the critical value method to test Ho: B₁ = 0 versus H₁ : ₁ > 0. Can you conclude that systolic blood pressure is useful in predicting diastolic blood pressure? Use the a= 0.05 level of significance. 71 Find the critical value(s). Round the answer to three decimal places. If there is more than one critical value, separate them with commas. X +0 S
- A scientist wants to develop a model to describe the relationship between the average daily temperature, x °C, and her household’s daily energy consumption, y kWh, in winter. A random sample of the average daily temperature and her household’s daily energy consumption are taken from 10 winter days and shown in the table. x -0.4 -0.2 0.3 0.8 1.1 1.4 1.8 2.1 2.5 2.6 y 28 30 26 25 26 27 26 24 22 21 You may use: Sy=255 Sxy=283.8 Syy= 64.5 Find a value for the product moment correlation coefficient r for this data Explain what the value of the product moment corelation tells you about the relationship between daily temperature and the household energy consumption.Lead Measurement. Laboratories A and B made multiple measurements on prepared wastewater effluent specimens to which lead (Pb) had been added in the amount of 1.25 µg/L or 2.5 µg/L. The background lead concentration was low, but not zero. Compare the bias and precision of the two laboratories. Laboratory A Spike = 1.25 1.1 2.0 1.3 1.0 1.1 0.8 0.8 0.9 0.8 Spike = 2.5 2.8 3.5 2.3 2.7 2.3 3.1 2.5 2.5 2.5 Laboratory B Spike = 1.25 2.35 2.86 2.70 2.56 2.88 2.04 2.78 2.16 2.43 Spike = 2.5 5.30 4.72 3.64 5.04 3.62 4.53 4.57 4.27 3.88of colour Example 13.7 A company has introduced a new drug B to cure common cold. It is being compared against an existing drug A. The relevant data are shown below: Нelped Harmed No effect Total Drug A Drug B 44 10 26 80 52 10 18 80 Total 96 20 44 160 Is the new drug more effective in curing cold?
- Q.1 Q.1 Two samples A and B were taken from a large concrete mix and tested for the compressive strength of concrete (in MPa), find the mean, median and mode of cach of the two samples. The results of tested specimens from each sample were as follows: 国 Compressive Strength 15 18 21 24 27 30 (MPa) Sample A Frequency 2 2 4 1 Sample B Frequency 3 2 2 1 Option 1 13Can you explain 4.31 ? Thank youA random sample of 42 earthquakes that have occurred between January 2015 and September 2017 was selected and for each earthquake the magnitude of the earthquake and the number of people killed was recorded. The data appear in the scatterplot below. 400 350 300 250 200 150 100 50 0 3 -50 4 5 6 7 8 9 10 -100 -150 Magnitude of Earthquake 8 Consider the scatterplot above question 2. Use this scatterplot to describe completely the relationship between the magnitude of the earthquake and the number of people killed. Positive and linear Negative, moderate, linear O Negative, strong, linear Positive, moderate, linear Number of People Killed ---
- Q3.1 Cholesterol Before and After Treatment A random sample of 16 people with high cholesterol were given a new drug designed to lower cholesterol levels. The table contains the cholesterol levels (in milligrams per deciliter) measured before and after treatment for each person. Person 1 2 3 4 Before 237 248 260 266 After 176 178 191 192 Person 9 10 11 14 15 16 Before 283 284 286 289 292 293 295 299 After 215 212 204 214 214 192 216 206 Save Answer Do these data support the claim that the average reduction in cholesterol for people on this medication would be greater than 70 mm/dL? Q3.2 Conditions Hypotheses: Write the appropriate hypotheses, including defining the parameters and identifying the subscripts appropriately. (Note: you are not required to use Greek letters. For example, writing sigma is sufficient for σ.) Save Answer 5 6 7 273 274 275 277 195 187 212 196 12 Q3.3 Mechanics Conditions: Use your own paper to explain how the Normal condition for this test has been met. Then…Question 4 Beachcomber Ltd in a local car dealership that sells used and new vehicles. The manager of the company wants to know how different variables affect the sales of his vehicles. A random sample of yearly data was taken with the view to testing the model: SALES=a+BAGE+YMIL+&ENG Where SÄLES= amount that a vehícle is sold for($000's), AGE = age of the vehicle, MIL= the total mileage of the vehicle at the point of sale and ENG= the size of the engine. The sample of data was processed using MINITAB and the following is an extract of the output obtained: The regression equation is ***** Coef StDev t-ratio p-value Predict or Constan 1.7586 0.2525 6.9648 0.0000 AGE 0.2124 0.3175 0.5042 ** MIL -0.7527 0.3586 -2.0991 7.7664 0.0000 *** ENG 4.8124 Analysis of Variance DF MS Source 3 413.1291 138.709 **** 0.00 Regressi 7 on 50 457.7607 2.2888 Error Total 53 a) What is dependent and independent variables? b) Fully write out the regression equation c) Fill in the missing values *', '**',…QUESTION 14 CardioGood Fitness Treadmill Products Data The market research team at CardioGood Fitness retail store wants to investigate whether there are differences across the product lines of treadmills sold; TM195 (low-end model), TM498 (medium grade model) and TM798 (high-end model) with respect to customer characteristics. The team decides to collect data on individuals who purchased a treadmill at a CardioGood Fitness retail store during the past three months. One question the team is interested in is if there is a difference in the miles of intended use of the treadmill between males and Females. t-Test: Two-Sample Assuming Unequal Variances MaleMiles Female Miles Mean 112.81 89.99 Variance 2991.43 2006.76 Observations 104 76 Hypothesized Mean Difference df 176 t Stat 3.0732 P(T<=t) one-tail 0.0012 t Critical one-tail 1.6536 P(T<=t) two-tail 0.0025 t Critical two-tail 1.9735 In the essay box, clearly answer questions 1-5 below: 1. Is this conducting a one-sided test or a…