Dr. Smith conducts research concerning the association between deception and trust of other individuals. She recruits six subjects to take part in their study. Each subject is also asked to "list the number of times you have lied in the past week," as a measure of deception. Also, each subject is asked, "on a scale of 1 to 7 (1 being none and 7 being a lot) how much do you trust individuals?" Here is the data: Ps Deception (X) 1 2 3 4 5 6 4 3 7 2 5 3 The research hypothesis is that there is an association between deception and trust of people. H₁: Step 1. Express the substantive question as two statistical hypotheses. Ho: 4 " Trust (Y) 4 4 3 6 3 14 « +
Dr. Smith conducts research concerning the association between deception and trust of other individuals. She recruits six subjects to take part in their study. Each subject is also asked to "list the number of times you have lied in the past week," as a measure of deception. Also, each subject is asked, "on a scale of 1 to 7 (1 being none and 7 being a lot) how much do you trust individuals?" Here is the data: Ps Deception (X) 1 2 3 4 5 6 4 3 7 2 5 3 The research hypothesis is that there is an association between deception and trust of people. H₁: Step 1. Express the substantive question as two statistical hypotheses. Ho: 4 " Trust (Y) 4 4 3 6 3 14 « +
MATLAB: An Introduction with Applications
6th Edition
ISBN:9781119256830
Author:Amos Gilat
Publisher:Amos Gilat
Chapter1: Starting With Matlab
Section: Chapter Questions
Problem 1P
Related questions
Question

Transcribed Image Text:What is the center of the distribution?
What are the critical values? +
Step 3. Compute the statistics.
On a sheet of paper create a Table for SSx, SSy, and SP. Use those calculations to
complete this Table of descriptive statistics:
Statistics
SP
SSX
Ssy
df
IN
3 decimal places
r=
From the above Table report the following values:
SEr=
Values
Using the descriptive statistics above,
(1) transform the sample statistic (r) into a test statistic:
(2) determine the 95% CI around r: [

Transcribed Image Text:Dr. Smith conducts research concerning the association between
deception and trust of other individuals. She recruits six subjects to take
part in their study. Each subject is also asked to "list the number of times
you have lied in the past week," as a measure of deception. Also, each
subject is asked, "on a scale of 1 to 7 (1 being none and 7 being a lot) how
much do you trust individuals?"
Here is the data:
Ps Deception (X)
1
2
13
st
15
16
|4
3
7
2
5
H₁:
|
13
The research hypothesis is that there is an association between deception
and trust of people.
♦
Step 1. Express the substantive question as two statistical hypotheses.
Ho:
◄►
Trust (Y)
14
14
13
♦
(O
◆
6
13
14
Expert Solution
This question has been solved!
Explore an expertly crafted, step-by-step solution for a thorough understanding of key concepts.
This is a popular solution!
Trending now
This is a popular solution!
Step by step
Solved in 2 steps

Follow-up Questions
Read through expert solutions to related follow-up questions below.
Follow-up Question
the test statistic given above keeps telling me its wrong everytime i input it.

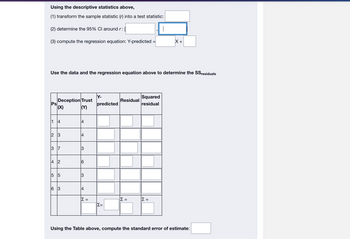
Transcribed Image Text:Using the descriptive statistics above,
(1) transform the sample statistic (r) into a test statistic:
(2) determine the 95% CI around r: [
(3) compute the regression equation: Y-predicted
Use the data and the regression equation above to determine the SS residuals
Ps
Deception Trust
(M)
LO
(X)
+
દા ટા
w
+
+
16
s
=
Y-
predicted
ΙΣ=
M
Residual
Σ =
Squared
residual
X +
Σ =
Using the Table above, compute the standard error of estimate:
Solution
Recommended textbooks for you

MATLAB: An Introduction with Applications
Statistics
ISBN:
9781119256830
Author:
Amos Gilat
Publisher:
John Wiley & Sons Inc

Probability and Statistics for Engineering and th…
Statistics
ISBN:
9781305251809
Author:
Jay L. Devore
Publisher:
Cengage Learning

Statistics for The Behavioral Sciences (MindTap C…
Statistics
ISBN:
9781305504912
Author:
Frederick J Gravetter, Larry B. Wallnau
Publisher:
Cengage Learning

MATLAB: An Introduction with Applications
Statistics
ISBN:
9781119256830
Author:
Amos Gilat
Publisher:
John Wiley & Sons Inc

Probability and Statistics for Engineering and th…
Statistics
ISBN:
9781305251809
Author:
Jay L. Devore
Publisher:
Cengage Learning

Statistics for The Behavioral Sciences (MindTap C…
Statistics
ISBN:
9781305504912
Author:
Frederick J Gravetter, Larry B. Wallnau
Publisher:
Cengage Learning

Elementary Statistics: Picturing the World (7th E…
Statistics
ISBN:
9780134683416
Author:
Ron Larson, Betsy Farber
Publisher:
PEARSON

The Basic Practice of Statistics
Statistics
ISBN:
9781319042578
Author:
David S. Moore, William I. Notz, Michael A. Fligner
Publisher:
W. H. Freeman

Introduction to the Practice of Statistics
Statistics
ISBN:
9781319013387
Author:
David S. Moore, George P. McCabe, Bruce A. Craig
Publisher:
W. H. Freeman