Could you show me a step-by-step example of a Chi-Square Test (it doesn't matter which one you pick), and go through the full hypothesis test procedure.
Introductory Statistics 3rd edition - Chapter 10 Chi-Square Test
Could you show me a step-by-step example of a Chi-Square Test (it doesn't matter which one you pick), and go through the full hypothesis test procedure.
I am unsure how to do one.
Chi square test for independence:
Suppose data is collected on two categorical variables from the same set of individuals. Each categorical variable has at least two levels, so that there are several combinations of the levels of the two categories.
The frequency of occurrence of each combination of the two categories is noted for the subjects considered in the study.
The chi-squared test of independence helps to determine using a structured hypothesis testing method, to determine whether the two variables have a significant relationship, or are independent of each other.
Assumptions:
The primary assumptions and conditions that must be satisfied in order to conduct a chi-square test of independence are as follows:
- The sample must be collected using random methods, to ensure that the observations are all independent of one another and there is no unnecessary bias.
- The variables of interest, the association between which is to be tested, must be categorical, each with at least two categories.
- The expected count for each cell representing a combination of the levels of the categorical variables of interest must be at least 5.
Test statistic and asymptotic distribution:
Suppose one of the categorical variables has r levels, and the other one has c levels. Then, there are a total of rc combinations of the levels of the variable.
Suppose the categories of the first variable are recorded along the rows, so that there will be r rows of observations, and the categories of the second variable are recorded along the columns, so that there will be c columns of observations. As a result, the data or frequencies will be stored in a (r × c) contingency table.
Consider the observation in the ith row and jth column of the table, that is, in the cell (i, j) for i = 1, 2, …, r, and j = 1, 2, …, c.
Denote the observed frequency in the cell (i, j) by Oij.
The null and alternative hypotheses are ,
H0: Attributes A and B are independent.
H1: Attributes A and B are not independent.
The expected frequency of the cell (i, j), that is, the cell containing the frequency of the combination- ith level of the first variable and jth level of the second variable, if the two categories are independent, is, Eij = [(total of row i) ∙ (total of column j)] / (grand total).
Now, the formula for the chi square test statistic for the test of independence is:
The degrees of freedom for the test statistic would be, df = (r – 1) ∙ (c – 1).
If the null hypothesis is true, that is, if the categories are truly independent, then the asymptotic distribution of the test statistic for the chi-squared test of independence would be a χ2 distribution with (r – 1) ∙ (c – 1) degrees of freedom.
Criterion for rejecting the null hypothesis:
if the calculated value of chi-square is less than the table value at a certain level of significance for given degrees of freedom(r-1) (c-1) where r is the number of rows and c is the number of columns, conclude that null hypothesis stands which means the two attributes are independent or not associated.
If the calculated value of chi-square is greater than the critical value then the null hypothesis can be rejected.
Evaluation of the p-value:
P-value is the probability of observing a sample statistic as extreme as the test statistic. It is the area under the Chi-square distribution usually to the right of the test statistics (one-tailed) or could sometimes be a two tailed test.
If the p-value is completely within the critical area or less than the level of significance, null hypothesis would be rejected. P-value can be found using the table of chi-square distribution. It is determined based on the result of the test statistic.
Hypothetical Formulation of test of Independence:
- Specify the null and alternative Hypothesis as follows: H0: Attributes A and B are independent. H1: Attributes A and B are not independent.
- Set the significance level: Generally, the significance level is set as 5% that means that there is a 5% chance that the alternative hypothesis would be accepted, when the null hypothesis is actually true.
- Calculation of the test statistic and corresponding p — value.
- Drawing a conclusion based on the critical value or the p-value.
Example:
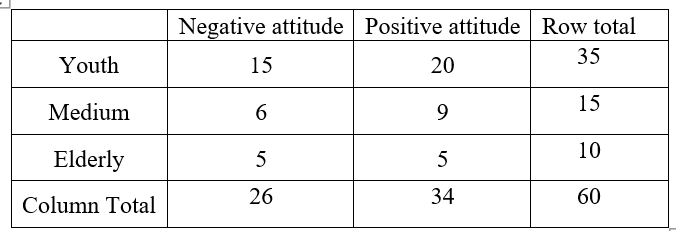
It is tested whether there is an association between attitudes regarding compulsory putting of masks wherever in public.
There are 3 categories of age group: Youth, Medium and elderly.
Those with positive attitude are 34 detailed as follows: Youth 20, medium adults 9 and elderly 5.
Those with negative attitude were stratified as follows:15 youth,6 medium adults and 5 elderly.
The 3×2 contingency table is as follows:

Step by step
Solved in 5 steps with 2 images


