Consider the following data drawn independently from normally distributed populations: x−1x−1 = −1.6 x−2x−2 = −16.3 s12 = 8.9 s22 = 7.9 n1 = 23 n2 = 15 a. Construct the 95% confidence interval for the difference between the population means. Assume the population variances are unknown but equal. (Round all intermediate calculations to at least 4 decimal places and final answers to 2 decimal places.) Confidence interval is __________ to ___________ b. Specify the competing hypotheses in order to determine whether or not the population means differ. multiple choice 1 H0: μ1 − μ2 = 0; HA: μ1 − μ2 ≠ 0 H0: μ1 − μ2 ≥ 0; HA: μ1 − μ2 < 0 H0: μ1 − μ2 ≤ 0; HA: μ1 − μ2 > 0 c. Using the confidence interval from part a, can you reject the null hypothesis? multiple choice 2 Yes, since the confidence interval includes the hypothesized value of 0. No, since the confidence interval includes the hypothesized value of 0. Yes, since the confidence interval does not include the hypothesized value of 0. No, since the confidence interval does not include the hypothesized value of


| Consider the following data drawn independently from |
| x−1x−1 = −1.6 | x−2x−2 = −16.3 |
| s12 = 8.9 | s22 = 7.9 |
| n1 = 23 | n2 = 15 |
| a. |
Construct the 95% confidence interval for the difference between the population means. Assume the population variances are unknown but equal. (Round all intermediate calculations to at least 4 decimal places and final answers to 2 decimal places.) |
| Confidence interval is __________ to ___________ |
| b. |
Specify the competing hypotheses in order to determine whether or not the population means differ. |
multiple choice 1
|
| c. | Using the confidence interval from part a, can you reject the null hypothesis? |
multiple choice 2
|
(a)
Obtain the 95% confidence interval for the difference between two population means.
The 95% confidence interval for the difference between two population means is obtained below:
The formula for two sample t-test confidence interval is,
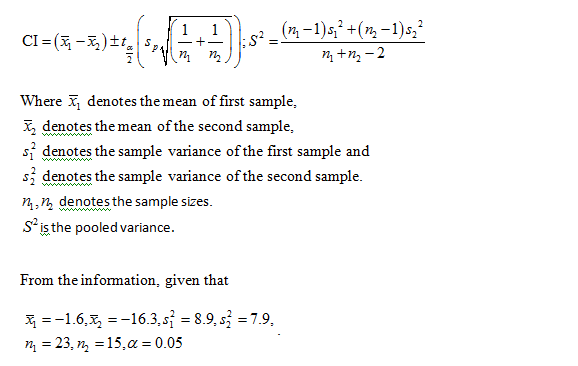
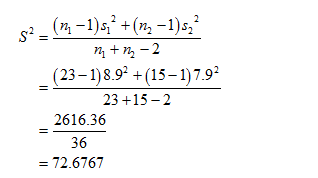
Obtain the value of the pooled variance.
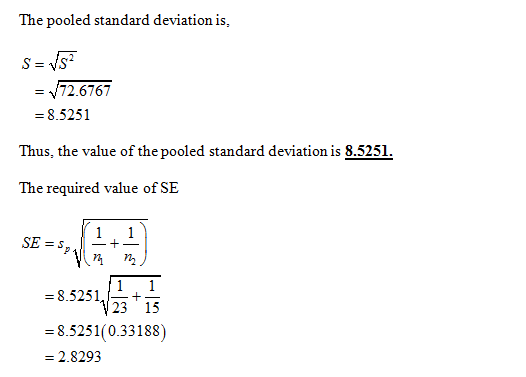
The value of the pooled variance is obtained below :
Use EXCEL Procedure for finding the critical value of t.
Follow the instruction to obtain the critical value of t:
- Open EXCEL
- Go to Formula bar.
- In formula bar enter the function as“=TINV”
- Enter the probability as 0.05.
- Enter the degrees of freedom as 36.
- Click Enter.
EXCEL output:
From the EXCEL output, the critical value of t at the 0.05 level of significance with the 36 degrees of freedom is 2.0281.
The required confidence interval is,
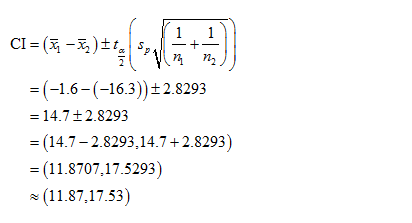
The 95% confidence interval for the difference between two population means is between 11.87 to 17.53.

Trending now
This is a popular solution!

Step by step
Solved in 2 steps with 5 images


