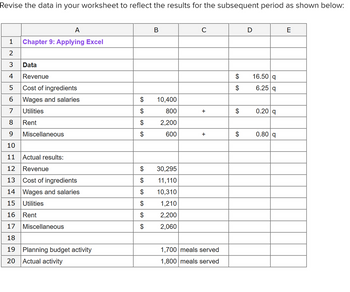
Chapter 9: Applying Excel Data Revenue Cost of ingredients Wages and salaries Utilities Rent Miscellaneous Actual results: Revenue Cost of ingredients Wages and salaries Utilities Rent Miscellaneous Planning budget activity Actual activity Meals served Revenue Expenses: Cost of ingredients Wages and salaries Utilities Rent $10,400 $800 $2,200 $600 Miscellaneous Total expenses Net operating income $27,920 $11,110 $10,130 $1,080 $2,200 $2,240 Enter a formula into each of the cells marked with a ? below Review Problem: Variance Analysis Using a Flexible Budget Construct a flexible budget performance report 1,800 meals served 1,700 meals served + ? + Revenue and Actual Spending Results Variances ? ? ? ? ? ? ? ? ? ? ? ? ? ? ? ? $16.50 q $6.25 q $0.20 q $0.80 q Flexible Budget ? ? ? UNNN... ? ? ? ? ? ? Activity Variances ? ? ? ? ? ? ? ? Planning Budget ? ? ? ? ? ? ? ? ?

FINANCIAL ACCOUNTING
10th Edition
ISBN:9781259964947
Author:Libby
Publisher:Libby
Chapter1: Financial Statements And Business Decisions
Section: Chapter Questions
Problem 1Q
icon
Related questions
icon
Concept explainers
Question
Download the Applying Excel form and enter formulas in all cells that contain question marks.
For example, in cell B30 enter the formula "= B20".
Notes:
In the text, variances are always displayed as positive numbers. To accomplish this, you can use the ABS() function in Excel. For example, the formula in cell C31
would be "=ABS(E31-B31)".
Cells D31 through D39 and G31 through G39 already contain formulas to compute and display whether variances are Favorable or Unfavorable. Do not enter data
or formulas into those cells-if you do, you will overwrite these formulas.
After entering formulas in all of the cells that contained question marks, verify that the amounts match the numbers in the example in the text.
Required:
1. Check your worksheet by changing the revenue in cell D4 to $16.00; the cost of ingredients in cell D5 to $6.50; and the wages and salaries in cell B6 to $10,000.
The activity variance for net operating income should now be $850 U and the spending variance for total expenses should be $410 U. If you do not get these
answers, find the errors in your worksheet and correct them.
Save your completed Applying Excel form to your computer and then upload it here by clicking “Browse.” Next, click “Save." You will use this worksheet to
answer the questions in Part 2.
Transcribed Image Text:Download the Applying Excel form and enter formulas in all cells that contain question marks. For example, in cell B30 enter the formula "= B20". Notes: In the text, variances are always displayed as positive numbers. To accomplish this, you can use the ABS() function in Excel. For example, the formula in cell C31 would be "=ABS(E31-B31)". Cells D31 through D39 and G31 through G39 already contain formulas to compute and display whether variances are Favorable or Unfavorable. Do not enter data or formulas into those cells-if you do, you will overwrite these formulas. After entering formulas in all of the cells that contained question marks, verify that the amounts match the numbers in the example in the text. Required: 1. Check your worksheet by changing the revenue in cell D4 to $16.00; the cost of ingredients in cell D5 to $6.50; and the wages and salaries in cell B6 to $10,000. The activity variance for net operating income should now be $850 U and the spending variance for total expenses should be $410 U. If you do not get these answers, find the errors in your worksheet and correct them. Save your completed Applying Excel form to your computer and then upload it here by clicking “Browse.” Next, click “Save." You will use this worksheet to answer the questions in Part 2.
A
1 Chapter 9: Applying Excel
2
3 Data
4 Revenue
5 Cost of ingredients
6 Wages and salaries
7 Utilities
8 Rent
9 Miscellaneous
10
11 Actual results:
12 Revenue
13 Cost of ingredients
27
28
29
30 Meals served
31 Revenue
32 Expenses:
33
34
35
36
37 Miscellaneous
38 Total expenses
39 Net operating income
40
B
Cost of ingredients
$10,400
$800
$2,200
$600
Wages and salaries
Utilities
Rent
$27,920
$11,110
$10,130
$1,080
$2,200
$2,240
14 Wages and salaries
15 Utilities
16 Rent
17 Miscellaneous
18
19 Planning budget activity
20 Actual activity
21
22 Enter a formula into each of the cells marked with a ? below
23 Review Problem: Variance Analysis Using a Flexible Budget
24
25 Construct a flexible budget performance report
26
1,800 meals served
1,700 meals served
Actual
Results
?
?
~.~.~.~.·.~.~.
?
?
?
?
?
+
?
+
?
Revenue
and
Spending
Variances
?
~.~.~.c.
?
?
?
?
?
?
?
D
$16.50 q
$6.25 q
$0.20 q
$0.80 q
E
Flexible Activity
Budget Variances
?
?
F
?
?
?
?
?
?
?
?
~.~.~.C.C.S
?
?
?
?
?
?
?
H
Planning
Budget
?
?
?
?
?
?
?
?
?
Transcribed Image Text:A 1 Chapter 9: Applying Excel 2 3 Data 4 Revenue 5 Cost of ingredients 6 Wages and salaries 7 Utilities 8 Rent 9 Miscellaneous 10 11 Actual results: 12 Revenue 13 Cost of ingredients 27 28 29 30 Meals served 31 Revenue 32 Expenses: 33 34 35 36 37 Miscellaneous 38 Total expenses 39 Net operating income 40 B Cost of ingredients $10,400 $800 $2,200 $600 Wages and salaries Utilities Rent $27,920 $11,110 $10,130 $1,080 $2,200 $2,240 14 Wages and salaries 15 Utilities 16 Rent 17 Miscellaneous 18 19 Planning budget activity 20 Actual activity 21 22 Enter a formula into each of the cells marked with a ? below 23 Review Problem: Variance Analysis Using a Flexible Budget 24 25 Construct a flexible budget performance report 26 1,800 meals served 1,700 meals served Actual Results ? ? ~.~.~.~.·.~.~. ? ? ? ? ? + ? + ? Revenue and Spending Variances ? ~.~.~.c. ? ? ? ? ? ? ? D $16.50 q $6.25 q $0.20 q $0.80 q E Flexible Activity Budget Variances ? ? F ? ? ? ? ? ? ? ? ~.~.~.C.C.S ? ? ? ? ? ? ? H Planning Budget ? ? ? ? ? ? ? ? ?
Expert Solution
trending now

Trending now

This is a popular solution!

steps

Step by step

Solved in 3 steps

Blurred answer
Follow-up Questions
Read through expert solutions to related follow-up questions below.
Follow-up Question
c. What is the spending variance for wages and salaries?
**Note:** Indicate the effect of each variance by selecting "F" for favorable, "U" for unfavorable, and "None" for no effect (i.e., zero variance).

[Text box] The amount of the spending variance for wages and salaries [Dropdown box]

d. What is the spending variance for total expenses?
**Note:** Indicate the effect of each variance by selecting "F" for favorable, "U" for unfavorable, and "None" for no effect (i.e., zero variance).

[Text box] The amount of the spending variance for total expenses [Dropdown box]
Transcribed Image Text:c. What is the spending variance for wages and salaries? **Note:** Indicate the effect of each variance by selecting "F" for favorable, "U" for unfavorable, and "None" for no effect (i.e., zero variance). [Text box] The amount of the spending variance for wages and salaries [Dropdown box] d. What is the spending variance for total expenses? **Note:** Indicate the effect of each variance by selecting "F" for favorable, "U" for unfavorable, and "None" for no effect (i.e., zero variance). [Text box] The amount of the spending variance for total expenses [Dropdown box]
Solution
Bartleby Expert
SEE SOLUTION
Follow-up Question
### Chapter 9: Applying Excel

#### Data

- **Revenue**: $16.50 * q (quantity)
- **Cost of ingredients**: $6.25 * q (quantity)
- **Wages and salaries**: $10,400
- **Utilities**: $800 + $0.20 * q (quantity)
- **Rent**: $2,200
- **Miscellaneous**: $600 + $0.80 * q (quantity)

#### Actual Results:

- **Revenue**: $30,295
- **Cost of ingredients**: $11,110
- **Wages and salaries**: $10,310
- **Utilities**: $1,210
- **Rent**: $2,200
- **Miscellaneous**: $2,060

#### Activity Levels:

- **Planning budget activity**: 1,700 meals served
- **Actual activity**: 1,800 meals served

This table provides a comparison between the projected costs and revenues versus the actual results, as well as the planned versus actual activity levels in terms of meals served.
Transcribed Image Text:### Chapter 9: Applying Excel #### Data - **Revenue**: $16.50 * q (quantity) - **Cost of ingredients**: $6.25 * q (quantity) - **Wages and salaries**: $10,400 - **Utilities**: $800 + $0.20 * q (quantity) - **Rent**: $2,200 - **Miscellaneous**: $600 + $0.80 * q (quantity) #### Actual Results: - **Revenue**: $30,295 - **Cost of ingredients**: $11,110 - **Wages and salaries**: $10,310 - **Utilities**: $1,210 - **Rent**: $2,200 - **Miscellaneous**: $2,060 #### Activity Levels: - **Planning budget activity**: 1,700 meals served - **Actual activity**: 1,800 meals served This table provides a comparison between the projected costs and revenues versus the actual results, as well as the planned versus actual activity levels in terms of meals served.
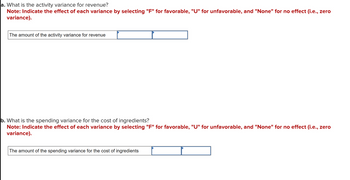
### Understanding Variances in Financial Analysis

#### a. Activity Variance for Revenue
**Question:** What is the activity variance for revenue?

**Instructions:** Indicate the effect of each variance by selecting "F" for favorable, "U" for unfavorable, and "None" for no effect (i.e., zero variance).

- **Input Box:** Enter the amount of the activity variance for revenue.
- **Selection Box:** Choose the type of effect ("F", "U", or "None").

#### b. Spending Variance for the Cost of Ingredients
**Question:** What is the spending variance for the cost of ingredients?

**Instructions:** Indicate the effect of each variance by selecting "F" for favorable, "U" for unfavorable, and "None" for no effect (i.e., zero variance).

- **Input Box:** Enter the amount of the spending variance for the cost of ingredients.
- **Selection Box:** Choose the type of effect ("F", "U", or "None").

These prompts are designed to help analyze and categorize variances, which are crucial in financial assessments for understanding cost management and revenue optimization.
Transcribed Image Text:### Understanding Variances in Financial Analysis #### a. Activity Variance for Revenue **Question:** What is the activity variance for revenue? **Instructions:** Indicate the effect of each variance by selecting "F" for favorable, "U" for unfavorable, and "None" for no effect (i.e., zero variance). - **Input Box:** Enter the amount of the activity variance for revenue. - **Selection Box:** Choose the type of effect ("F", "U", or "None"). #### b. Spending Variance for the Cost of Ingredients **Question:** What is the spending variance for the cost of ingredients? **Instructions:** Indicate the effect of each variance by selecting "F" for favorable, "U" for unfavorable, and "None" for no effect (i.e., zero variance). - **Input Box:** Enter the amount of the spending variance for the cost of ingredients. - **Selection Box:** Choose the type of effect ("F", "U", or "None"). These prompts are designed to help analyze and categorize variances, which are crucial in financial assessments for understanding cost management and revenue optimization.
Solution
Bartleby Expert
SEE SOLUTION
Knowledge Booster
Budgeting
Learn more about
Need a deep-dive on the concept behind this application? Look no further. Learn more about this topic, accounting and related others by exploring similar questions and additional content below.
Similar questions
  • SEE MORE QUESTIONS
Recommended textbooks for you
FINANCIAL ACCOUNTING
Accounting
ISBN:
9781259964947
Author:
Libby
Publisher:
MCG
Accounting
Accounting
Accounting
ISBN:
9781337272094
Author:
WARREN, Carl S., Reeve, James M., Duchac, Jonathan E.
Publisher:
Cengage Learning,
Accounting Information Systems
Accounting
ISBN:
9781337619202
Author:
Hall, James A.
Publisher:
Cengage Learning,
Horngren's Cost Accounting: A Managerial Emphasis…
Accounting
ISBN:
9780134475585
Author:
Srikant M. Datar, Madhav V. Rajan
Publisher:
PEARSON
Intermediate Accounting
Accounting
ISBN:
9781259722660
Author:
J. David Spiceland, Mark W. Nelson, Wayne M Thomas
Publisher:
McGraw-Hill Education
Financial and Managerial Accounting
Accounting
ISBN:
9781259726705
Author:
John J Wild, Ken W. Shaw, Barbara Chiappetta Fundamental Accounting Principles
Publisher:
McGraw-Hill Education