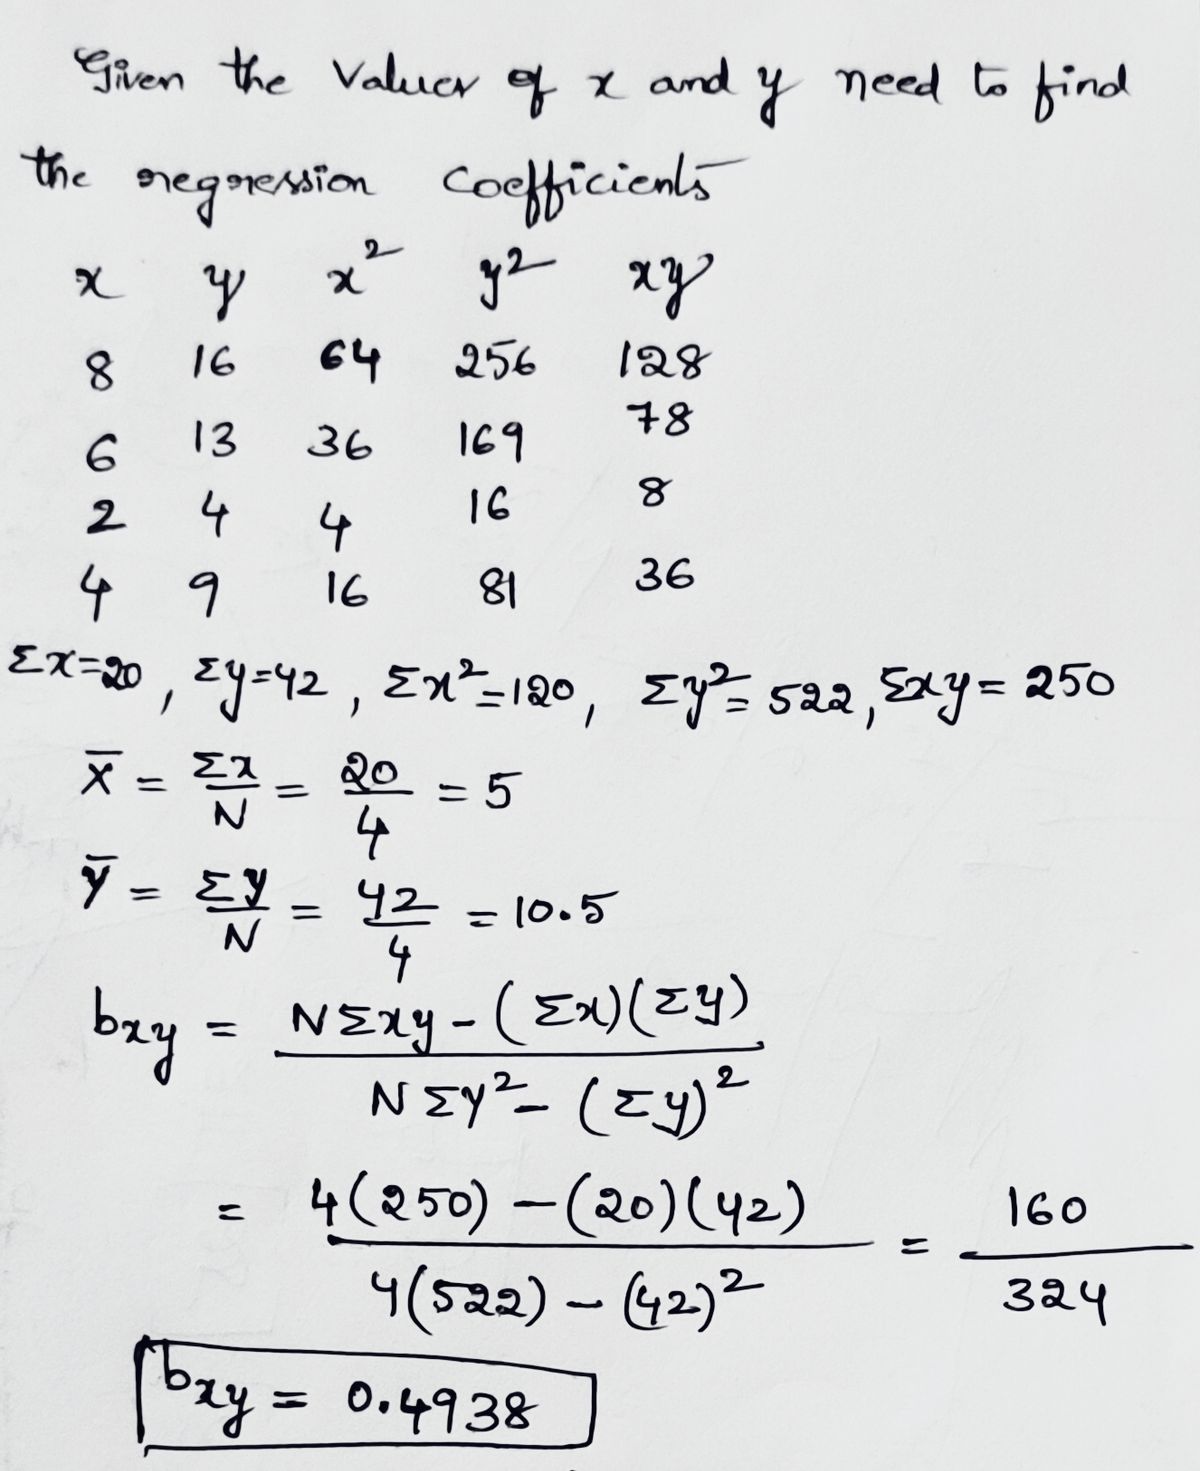
Calculation of Regression Coefficients Beer (X) Cigarettes (Y) 8 16 6 13 2 4 4 9
Q: e money raised and spent (both in millions of dollars) by all congressional campaigns for 8 recent…
A: The data is provided as follows:Money raised Money spent…
Q: Which of the following statements is correct about residuals? We find the regression line of best…
A: Given some options about residuals and we have to choose which among the given options are correct.
Q: A regression was run to determine if there Is a relationship between the happiness index (y) and…
A: In multiple linear regression, there will be more than one independent variable. In simple linear…
Q: Numbers of a particular type of sports cars sold in five different towns are given below, together…
A: Enter the given data into an excel sheet as shown below.
Q: 1 w 2 3 4 5 6 7 8 1 9 3 5 6 8 9 9 10 11 80 95 109 126 132 128 146 10 13 146 The data on y annual…
A: The question is about regression Given : y^ = 80.78 + 5.80 x x¯ = 7.5 ∑ xi - x¯ 2 = 124.50 s =…
Q: A Company sells products in several sales territories by making use of a single sales…
A: DW statistics value is used to determine the auto-correlation in the residuals of the regression…
Q: The final 2 question in this example is (e) Find the value of the coefficient of determination r2.…
A: Given, data on the variables: x-representing chips per second. y-representing temperature e). The…
Q: Market trader sells mobiles on his stall. He sells the mobiles for a different fixed price, x…
A: From given data, X Y X*Y X*X Y*Y 5 12 60 25 144 2 10 20 4 100 9 15 135 81 225 3 11 33 9…
Q: Q3/ Find the equation of the regression line for the data shown Company Number of A В C E F G 6. 2 4…
A:
Q: What will you conclude about a regression model if the Breusch-Pagan test results in a smal p-value?…
A: Regression is a statistical procedure that involve a dependent variable and one or more independent…
Q: 2. In simple linear regression, when X and Y are negatively correlated, the multiple-R value is (A)…
A: Simple linear regression: simple linear regression is a linear regression model with a single…
Q: The following table shows worldwide sales of a type of phone and their average selling prices in…
A: In this case, selling price (p) is the independent variable and sales (q) is the dependent variable.
Q: 36 6 5 79 6 7 8 56 the linear regression of the data? egers or decimals for any numbers in the ion.…
A: The regression equation is. Y=b0 +mx Here b0 is a intercept and m is a slope
Q: The regression line that gives the linear relationship between the magnitude of the earthquake and…
A: Regression equation has two regression coefficients, they are slope and intercept. Slope comes…
Q: Given: Regression in picture Using data I ran a regression of average hourly earnings (wage) on…
A: Multiple linear regression model: A multiple linear regression model is given as y = b0 + b1x1 +…
Q: Find the correlation r between beak heat loss and temperature. Give your answer to three decimal…
A: xy1533163317331831193720442156225223452454254626552757285629603062The independent variable x…
Q: Correct and incorrect option explain
A: Part 2:Explanation:Step 1: Understand the Least-Squares Regression LineThe least-squares regression…
Q: (a) How many apartment buildings were in the sample? (b) Write the estimated regression equation.…
A: Here dependent variable Independent variable The partial ANOVA output and Regression equation is…
Q: What is the relationship between the attendance at a major league ball game and the total number of…
A: Given that : X Y X \cdot YX⋅Y X^2X2 Y^2Y2 55 7 385 3025 49 11 -0 0 121 0 36 9 324…
Q: The slope B of a simple linear regression model determines the coefficient of determination R. O…
A:
Q: Q1/ The table below shows the number of absences, x, in a Calculus course and the final exam grado,…
A: Since you have asked multiple questions, we will solve the first question for you. If you want any…
Q: 472 CHAPTER 14 | Correlation and Regression 16. A set of n = 15 pairs of scores (X and Y values)…
A: Linear regression model consist of one dependent and one independent variable
Q: Interpreting the coefficient of determination for comparison of regression lines [Use the calculator…
A: The given data indicates the scores of eight students on two part test and their first year GPA.
Q: The weight (in pounds) and height (in inches) for a child were measured every few months over a…
A: Least squared regression - minimizes the sum of the squared distances from the actual y-value to the…
Q: Use the given data to find the equation of the regression line. Examine the scatterplot and identify…
A: The independent variable is x The dependent variable is y We have to write the regression equation.
Q: Demand for Smartphones The following table shows worldwide sales of a type of phone and their…
A: Introduction: Regression analysis is used measures the association or linear relationship between…
Q: The least-squares regression equation is y=663.3x + 16,436 where y is the median income and x is he…
A: The least-square regression equation is where the independent variable x denotes the percentage of…
Q: Can we say that age of the bus is equated with the bus annual maintenance cost? Discuss your…
A: The regression equation has two coefficient of regression are slope and intercept value. There are…
Q: Find the equation of the regression line for the given data. Then construct a scatter plot of the…
A: Excel Procedure: Enter x and y in Excel>Data>Data Analysis> ‘Regression’>Select y under…
Q: The accompanying table shows results from regressions performed on data from a random sample of 21…
A: Determine the best predicted value of the city fuel consumption. The best predicted value of the…
Q: Multiple regression is a statistical method that includes ____ predictor variable(s) in the equation…
A: Multiple regression is used to examine the relationship between numerous independent (predictor)…
Q: Consider the regression model Houseprice = Bi + PSize + B Bedrooms +B&Size Bedr Suppose the…
A:
Q: SCUBA divers have maximum dive times they cannot exceed when going to different depths. The data in…
A: Given observation and calculation is shown belowDepth (X)Dive time…
Q: Step Two: Find the residual (difference between y and ŷ). Enter the answer only. What is the sum of…
A: xy557399117135159
Q: caribou in 1000's (x) 30 34 27 25 17 23 20 wolves (y) 66 79 70 60 48 55 60 5. What is the slope…
A:
Q: The systolic blood pressure dataset (in the third sheet of the spreadsheet linked above) contains…
A: Simple Linear Regression: The plot shows the linear relationship between the regressor Y and…
Q: Sodium (mg) Sodium (mg) Inu une eyuaion Ul tne legressiIOH NHe for the given data. Then construct a…
A: Solution: x y (x-x) (x-x)2 (y-y) (x-x)(y-y) 160 430 16.6667 277.7789 25 416.6675 170 480…
Q: e following data show the brand, price ($), and the overall score for six stereo headphones that…
A: The sum of square total is calculated by summing the difference between yi and y bar square and sum…
Q: Given the following information regarding a regression model with Y as dependent variable and X as…
A: The data given in the problem will help in calculating the standard errors of the regression model.…
Calculation of Regression Coefficients
Beer (X) |
Cigarettes (Y) |
8 |
16 |
6 |
13 |
2 |
4 |
4 |
9 |
Step by step
Solved in 2 steps with 2 images
- Demand for Smartphones The following table shows worldwide sales of a type of phone and their average selling prices in 2012, 2013, and 2017. Year 2012 2013 2017 Selling Price p ($100) 4 3 2 Sales q (billions) 0.7 1 2 Find the regression line (round coefficients to one decimal place). q(p) = Use the regression line to estimate the demand (in millions of units sold) when the selling price was $350. million3. Multiple Regression Analysis You have been asked to estimate the numberof trip productions that will result from anew development (single zone) being considered. While you asked forforecasted number of trips, your interns were busy checking Facebook, surfing the web, and texting their friends and collected the following data which is actually the forecasted number of households in your trafficanalysis zone based upon Auto Ownership and Family Size. Auto Ownership 1 Family Size 2 1 15 75 25 2 36 98 127 45 120 198 In a last-ditch effort to have something to show your boss in the morning, you scoured the internet for some type of regression equation you could use to estimate the numberof trips produced based upon the data your interns collected for you. You identified the following three possible regression equations to use: EQUATION 1: 0, = 0.08 + 0.895(SIZE) + 0.549(AO) EQUATION 2: 0, = 0.10 - 2.53(SIZE) + 1.64(AO.) EQUATION 3: 0, = 175.12 + 0.005(SIZE.) + 0.549(AO) Where: 0, = total…The tables show the amount of revenue (y) in billions for different companies x years after 2005. Match the table with the correct description of its regression model and correlation. Negative Linear Regression 1. a0 1 2 3 4 5 6 78 9 10 Strong Negative Correlation y 12 12 13 14 15 16 18 19 21 22 25 Positive Linear Regression * 0 1 2 3 4 5 6 7 89 10 y 20 18 17 15 13 14 16 18 21 25 28 2. Strong Positive Correlation Quadratic Regression * 0123 4 5 6 7 8 9 10 3. Strong Positive Correlation y 5679 13 15 18 24 25 28 30 Increasing Exponential Regression 4. x0 1 2 3 4 5 6 789 10 Strong Positive Correlation y 20 20 19 18 16 15 12 8765 Decreasing Exponential Regression z0 1 2 3 4 5 6 7 8 9 10 5. Strong Negative Correlation y 20 19 20 18 16 15 13 11 10 11 10
- P4. The least squared method called also the least squared regression method is one of the most commonly used methods in applications . Describe the importance of this method in modeling data. Provide an illustrative example for given data and interpret your results. Using your example illustrate the importance of the results.how to solve?16. Residuals and significance testing with a regression equation Experienced observers use aerial survey methods to estimate the number of snow geese in their summer range area west of Hudson Bay, Canada. A small aircraft flies over the range, and when a flock of geese is spotted, the observer estimates the number of geese in the flock. To investigate the reliability of the estimates, an airplane carrying two goose observers flies over 45 flocks. Each observer makes an independent estimate of the number of geese in each flock. A photograph is taken of each flock and a count made of the number of geese in the photograph. The sample data for the 45 flocks appear in the DataView tool. [Data source: These data were obtained from Lunneborg, C. E. (1994). Modeling experimental and observational data. Pacific Grove, CA: Duxbury Press.] Data SetGeese Sample Variables = 3 Observations = 45 Geese Flock ↓ Photo ↓ A Estimate ↓ B Estimate ↓ 1 62 40 50 2 26 30 20 3 88…
- What is the regression lineThe following table shows worldwide sales and projected sales of a certain type of phone and their average selling prices in 2020, 2022, and 2024. Year 2020 2022 2024 Selling Price ($100) p 6 5 4.5 Sales (billions) q 1 1.2 1.3 Find the regression line. 9(p) = Use the regression line to estimate the demand (in millions of units sold) when the selling price was $250. X million 1.6 Need Help? Read It Master ItDemand for Smartphones The following table shows worldwide sales of a type of phone and their average selling prices in 2012, 2013, and 2017. Year 2012 2013 2017 Selling Price p ($100) 4 Sales q (billions) 0.5 3 1 2 2 Find the regression line (round coefficients to one decimal place). q(p) = 1.0166 X Use the regression line to estimate the demand (in millions of units sold) when the selling price was $320. 1016.6 million