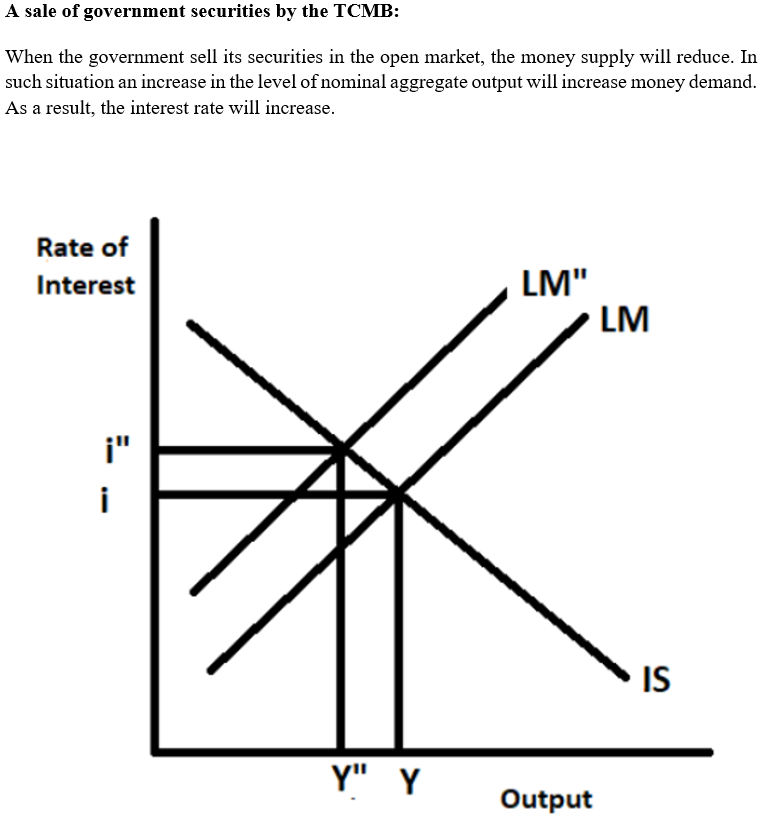
By using graphs, show and explain each of the following events as either leading to an increase or a decrease in the equilibrium interest rate? d)A sale of government securities by the TCMB f)An increase in the discount rate e)decrease in the level of aggregate output
By using graphs, show and explain each of the following events as either leading to an increase or a decrease in the equilibrium interest rate? d)A sale of government securities by the TCMB f)An increase in the discount rate e)decrease in the level of aggregate output

Chapter10: Aggregate Demand And Supply
Section10.A: The Self Correcting Aggregate Demand And Supply Model
Problem 6SQ

Related questions
Question
100%
By using graphs, show and explain each of the following events as either leading to an increase or a decrease in the equilibrium interest rate?
d)A sale of government securities by the TCMB
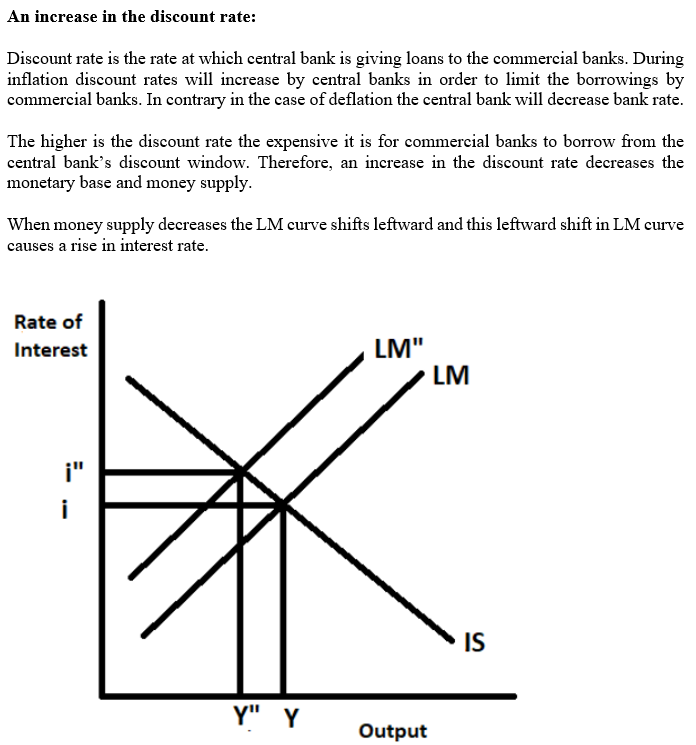
f)An increase in the discount rate
e)decrease in the level of
Expert Solution
Step 1
Step 2

Step by step
Solved in 3 steps with 3 images

Knowledge Booster


Learn more about
Need a deep-dive on the concept behind this application? Look no further. Learn more about this topic, economics and related others by exploring similar questions and additional content below.Recommended textbooks for you


Economics (MindTap Course List)
Economics
ISBN:
9781337617383
Author:
Roger A. Arnold
Publisher:
Cengage Learning

