Assuming the population variances are equal, is there evidence that the mean brand value is different for the technology sector than for the financial institutions sector? (Use a = 0.05.) Determine the hypotheses. Let μ, be the mean brand value for the technology sector and μ₂ be the mean brand value for the financial institutions sector. Choose the correct answer below. A. H₂H₁ 2H₂ H₁ H₂ H₂ OD. Ho: #₁ #₂ H₁: P₁ P₂ Brand Values 628 636 Technology Financial Institutions 265 399 456 414 449 531 518 849 838 823 975 983 1035 1091 Print Done - X
Assuming the population variances are equal, is there evidence that the mean brand value is different for the technology sector than for the financial institutions sector? (Use a = 0.05.) Determine the hypotheses. Let μ, be the mean brand value for the technology sector and μ₂ be the mean brand value for the financial institutions sector. Choose the correct answer below. A. H₂H₁ 2H₂ H₁ H₂ H₂ OD. Ho: #₁ #₂ H₁: P₁ P₂ Brand Values 628 636 Technology Financial Institutions 265 399 456 414 449 531 518 849 838 823 975 983 1035 1091 Print Done - X

MATLAB: An Introduction with Applications
6th Edition
ISBN:9781119256830
Author:Amos Gilat
Publisher:Amos Gilat
Chapter1: Starting With Matlab
Section: Chapter Questions
Problem 1P

Related questions
Question

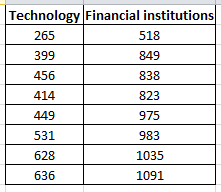
Transcribed Image Text:An evaluation was recently performed on brands and data were collected that classified each brand as being in the technology or financial institutions sector and also reported the brand value. The results in terms of value (in millions of dollars) are shown in the accompanying
data table. Complete parts (a) through (c).
Click the icon to view the data table.
a. Assuming the population variances are equal, is there evidence that the mean brand value is different for the technology sector than for the financial institutions sector? (Use α = 0.05.)
Determine the hypotheses. Let μ, be the mean brand value for the technology sector and μ₂ be the mean brand value for the financial institutions sector. Choose the correct answer below.
4₁
OA. Ho: ₁2H₂
H₁: H₁ <H₂
C. Ho: H₁ H2
H₁: H₁ H₂
C
Find the test statistic.
tSTAT (Round to two decimal places as needed.)
OB. Ho: H1 H₂
H₁: H₁> H₂
OD. Ho Hi#H2
H₁: H₁=H₂
Brand Values
Technology Financial Institutions
265
399
456
414
449
531
628
636
518
849
838
823
975
983
1035
1091
Print
Done
- X
Expert Solution
Step 1: Determine the given variables.
The question is about hypothesis testing.
Given :
No. of observations in the technology sector ( n1 ) = 8
No. of observations in the financial institutions sector ( n2 ) = 8
To find :
Is there any evidence that the mean brand value is different for the technology sector than the financial institutions sector ?

Step by step
Solved in 7 steps with 18 images

Recommended textbooks for you
MATLAB: An Introduction with Applications
Statistics
ISBN:
9781119256830
Author:
Amos Gilat
Publisher:
John Wiley & Sons Inc

Probability and Statistics for Engineering and th…
Statistics
ISBN:
9781305251809
Author:
Jay L. Devore
Publisher:
Cengage Learning

Statistics for The Behavioral Sciences (MindTap C…
Statistics
ISBN:
9781305504912
Author:
Frederick J Gravetter, Larry B. Wallnau
Publisher:
Cengage Learning
MATLAB: An Introduction with Applications
Statistics
ISBN:
9781119256830
Author:
Amos Gilat
Publisher:
John Wiley & Sons Inc
Probability and Statistics for Engineering and th…
Statistics
ISBN:
9781305251809
Author:
Jay L. Devore
Publisher:
Cengage Learning
Statistics for The Behavioral Sciences (MindTap C…
Statistics
ISBN:
9781305504912
Author:
Frederick J Gravetter, Larry B. Wallnau
Publisher:
Cengage Learning

Elementary Statistics: Picturing the World (7th E…
Statistics
ISBN:
9780134683416
Author:
Ron Larson, Betsy Farber
Publisher:
PEARSON

The Basic Practice of Statistics
Statistics
ISBN:
9781319042578
Author:
David S. Moore, William I. Notz, Michael A. Fligner
Publisher:
W. H. Freeman

Introduction to the Practice of Statistics
Statistics
ISBN:
9781319013387
Author:
David S. Moore, George P. McCabe, Bruce A. Craig
Publisher:
W. H. Freeman