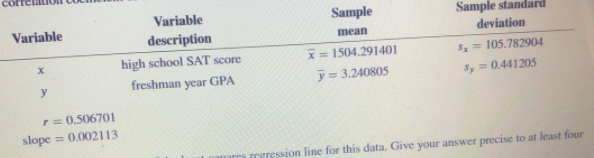
applications. He produces a scatterplot with SAT scores on the linear correlation coefficient of 0.506701. Additional sample statistics are summarized in the table below. Variable Sample Sample standard Variable description mean deviation high school SAT score x = 1504.291401 Sx = 105.782904 y freshman year GPA y = 3.240805 Sy = 0.441205 r= 0.506701 slope = 0.002113 Determine the y-intercept, a, of the least-squares regression line for this data. Give your answer precise to at least four decimal places.

Glencoe Algebra 1, Student Edition, 9780079039897, 0079039898, 2018
18th Edition
ISBN:9780079039897
Author:Carter
Publisher:Carter
Chapter4: Equations Of Linear Functions
Section4.5: Correlation And Causation
Problem 11PPS
icon
Related questions
icon
Concept explainers
Question
100%
estion 3 of 38
<>
university and gathers their freshman year GPA data and the high school SAI score reported on each of their college
applications. He produces a scatterplot with SAT scores on the horizontal axis and GPA on the vertical axis. The data has a
linear correlation coefficient of 0.506701. Additional sample statistics are summarized in the table below.
Variable
Sample
Sample standard
Variable
description
mean
deviation
high school SAT score
x 1504.291401
Sx = 105.782904
%3D
y
freshman year GPA
y = 3.240805
Sy = 0.441205
r = 0.506701
slope 0.002113
Determine the y-intercept, a, of the least-squares regression line for this data. Give your answer precise to at least four
decimal places.
tems of use
Thelp
about us
குசங்
careers
2:30 PM
10/24/20
o耳 国 @
hp
Transcribed Image Text:estion 3 of 38 <> university and gathers their freshman year GPA data and the high school SAI score reported on each of their college applications. He produces a scatterplot with SAT scores on the horizontal axis and GPA on the vertical axis. The data has a linear correlation coefficient of 0.506701. Additional sample statistics are summarized in the table below. Variable Sample Sample standard Variable description mean deviation high school SAT score x 1504.291401 Sx = 105.782904 %3D y freshman year GPA y = 3.240805 Sy = 0.441205 r = 0.506701 slope 0.002113 Determine the y-intercept, a, of the least-squares regression line for this data. Give your answer precise to at least four decimal places. tems of use Thelp about us குசங் careers 2:30 PM 10/24/20 o耳 国 @ hp
Expert Solution
steps

Step by step

Solved in 2 steps with 2 images

Blurred answer
Knowledge Booster
Correlation, Regression, and Association
Learn more about
Need a deep-dive on the concept behind this application? Look no further. Learn more about this topic, statistics and related others by exploring similar questions and additional content below.
Recommended textbooks for you
Glencoe Algebra 1, Student Edition, 9780079039897…
Algebra
ISBN:
9780079039897
Author:
Carter
Publisher:
McGraw Hill
Big Ideas Math A Bridge To Success Algebra 1: Stu…
Algebra
ISBN:
9781680331141
Author:
HOUGHTON MIFFLIN HARCOURT
Publisher:
Houghton Mifflin Harcourt
Holt Mcdougal Larson Pre-algebra: Student Edition…
Algebra
ISBN:
9780547587776
Author:
HOLT MCDOUGAL
Publisher:
HOLT MCDOUGAL