Antisocial personality disorder (ASPD) is characterized by deceitfulness, reckless disregard for the well-being of others, a diminished capacity for remorse, superficial charm, thrill seeking, and poor behavioral control. ASPD is not normally diagnosed in children or adolescents, but antisocial tendencies can sometimes be recognized in childhood or early adolescence. James Blair and his colleagues have studied the ability of children with antisocial tendencies to recognize facial expressions that depict sadness, happiness, anger, disgust, fear, and surprise. They have found that children with antisocial tendencies have selective impairments, with significantly more difficulty recognizing fearful and sad expressions. Suppose you have a sample of 20 16-year-old children with antisocial tendencies and you are particularly interested in the emotion of disgust. The average 16-year-old has a score on the emotion recognition scale of 12.95. (The higher the score on this scale, the more strongly an emotion has to be displayed to be correctly identified. Therefore, higher scores indicate greater difficulty recognizing the emotion). Assume that scores on the emotion recognition scale are normally distributed. You believe that children with antisocial tendencies will have a harder time recognizing the emotion of disgust (in other words, they will have higher scores on the emotion recognition test). What is your null hypothesis stated using symbols? What is your alternative hypothesis stated using symbols? This is a tailed test. Given what you know, you will evaluate this hypothesis using a statistic. Using the Distributions tool, locate the critical region for α = 0.05. t Distribution Degrees of Freedom = 33 -3.0-2.0-1.00.01.02.03.0x In order to use the t distribution, you will first need to determine the degrees of freedom (df) for α = 0.05. The degrees of freedom (df) is . The critical value of t is . Your sample of 16-year-old children with antisocial tendencies has an average score of 14.50 with a standard deviation of 2.95. Calculate the t statistic. To do this, you will first have to calculate the estimated standard error. The estimated standard error is . The t statistic is . (Hint: For the most precise results, retain four significant figures from your calculation of the standard error to calculate the t statistic. Round your final answer to four decimal places, and then round it again to two decimal places for your answer selection.) The t statistic lie in the critical region. Therefore, you reject the null hypothesis. Based on the results of this test, there enough evidence to conclude that children with antisocial tendencies have greater difficulty recognizing disgust than do children without antisocial tendencies.


t Distribution
Degrees of Freedom = 33
Given:
n = 20
μ = 12.95
∝ = 0.05
= 14.50
s = 2.95
It is believed that children with antisocial tendencies will have a harder time recognizing the emotion of disgust (in other words, they will have higher scores on the emotion recognition test).
The null and alternative hypothesis are,
H0: μ = 12.95
H1: μ > 12.95
This is a one-tailed (right tailed) test.
We reject the null hypothesis if t-value > t-critical value.
Given what we know, we will evaluate this hypothesis using a t-test statistic.
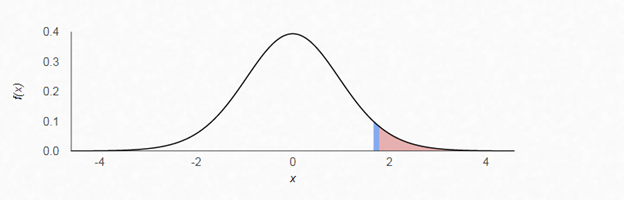
In order to use the t distribution, you will first need to determine the degrees of freedom (df) for α = 0.05. The degrees of freedom (df) is n-1 = 20 - 1 = 19. The critical value of t is 1.7291.
The critical region for α = 0.05 is as shown in the graph below:

Trending now
This is a popular solution!

Step by step
Solved in 2 steps with 1 images


