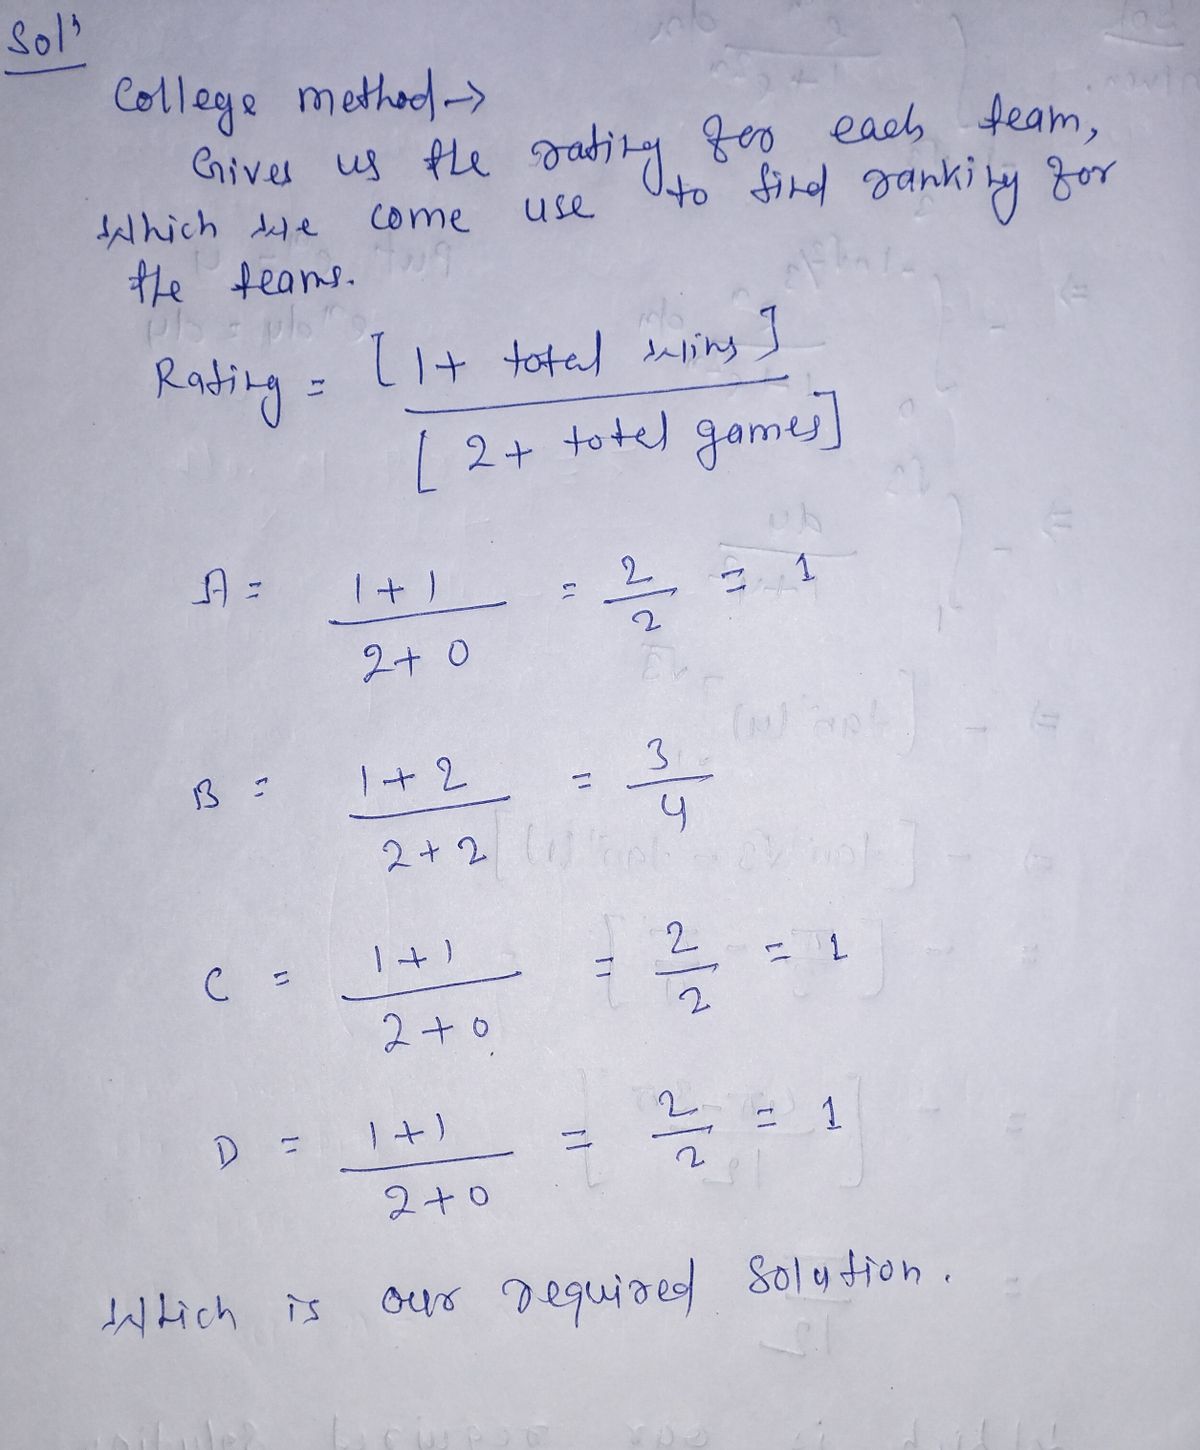
a. Use the Colley method to come up with a rating for each team, then rank them. b. What were some of the strengths and weaknesses of this method?
Q: hloe took three 100-point exams in her statistics class and scored 83, 81 nd 92. The second exam is…
A:
Q: Using limits to establish order of growth, determine the relationship between f(n) and logn 9(n) =…
A: Solution
Q: onrad wants to conduct a survey of students at his middle school to determine which sports they…
A: The objective of the question is to identify two survey methods that would likely generate fair and…
Q: b) Find the value of the chi-square statistic for the sample. (Round the expected frequencies to…
A: Percentage O E (O-E)^2 (O-E)^2/E 0.32 270 284.16 200.5056 0.70561 0.25 229 222 49 0.22072 0.2…
Q: Chipper Jones was the Major League Baseball league leader in 2008 according to batting average. For…
A: The random variable X defines the number of bases.
Q: A student earned grades of A, C, B, A, and D. Those courses had these corresponding numbers of…
A:
Q: e director of library services at a college did a survey of types of books (by subject) in the…
A: Subject Area % Observerd Expected (O-E)^2 (O-E)^2/E Business 32% 299 284.16 220.2256 0.775006…
Q: I have a 5 x 5 factorial between subjects design. Answer the following questions. a. How many…
A: Definition: Factorial Design An experiment that consists of multiple factors is called factorial…
Q: question: 1.) Matt E. Matic was applying for a job. To determine whether he could handle the job,…
A: If M, N and C are three finite sets that intersect each other and are in a union, their cardinal…
Q: Amy has two ways to travel from her home in Norco to her office in Los Angeles. One is to go via the…
A: State the hypotheses.
Q: For the multiple choice questions, circle the best answer:
A: For the Given scenarios, we need to choose the best option.
Q: he director of library services at a college did a survey of types of books (by subject) in the…
A: The sampling distribution is used in the problem is, chi square.
Q: pretend you actually ran the study you came up with. Make up the results (the test statistic values,…
A: Consider two groups of pupils, one receives special teaching while the other group does not receive…
Q: What was the class average
A: The results for 20-point multiple choice science quiz are as follows: 9 students scored 20, 4…
Q: A. Floor effect and left skew B. Ceiling effect and right skew C. Ceiling Effect and left skew D.…
A: Skewness shows the spread of the data set. It can be of two types, they are positive or right skew…
Q: Maci is a social networking maniac! Although she prefers Instagram, she also spends a lot of time…
A: Introduction A variable is a no., characteristic which can be counted or measured.
Q: Xochitl is worried that this month’s Red Chile batch is not as spicy as last month’s. To help test…
A: We have to conduct the Dependent Two-Sample Test to test this hypothesis.
Q: The data below represent the responses to two questions asked in a survey of 40 college students…
A:
Q: A survey of 800 nurses yielded the following information: 430 were health club members, 555 were…
A: Given data, Total number of nurses=800 in which Health club member nurses =430 Smokers nurses =555…
Q: Giving à test to a group of students, the grades and gender are summarized below B. C Total Male 10…
A: Given data: The grades and gender of a group of students is given in the provided contingency table.…
Q: V. EVALUATION: Given the following scores : 5, 7, 12, 14, 15, 22, 25, 30, 36, 42, 53, 65. Find: 1. Q…
A: Note: Since we only answer up to 3 sub-parts, we’ll answer the first 3. Please resubmit the question…
Q: (Use SPSS) Hanover County is known for many things, but one of the most popular is the Hanover…
A: To perform the complete appropriate analysis and choose the best model for predicting the quality…
Q: Use the following area diagram: Y N N N Y N Y Y Y Y If 120 students are surveyed concerning their…
A: Given: Area diagram
Q: Which of the binning method for giving letter grades is the most fair for students at the…
A: Equal Depth Binning method will be perfect for giving letter grades is the most fair for students at…
Q: Item#13 | Multiple Choice Control charts for count of nonconformities is called: a. p Chart b. c…
A: It is given that the statement about to the control charts. Here, need to find out the correct…
Q: (Simplify your answers. Round to one decimal place as needed.) Complete the following contingency…
A: The table shows the responses to two questions asked in a survey of 40 college students majoring in…
Q: a. how many degrees of freedome are there in this table? b.how many cells are in this table? c.…
A: a. The degrees of freedom for the given table is, Thus, the degrees of freedom is 1.
Q: The data below represent the responses to two questions asked in a survey of 40 college students…
A: Given Total male=22 Total female=18
Q: The data below represent the responses to two questions asked in a survey of 40 college students…
A:
Q: has two ways to travel from her home in Norco to her office in Los Angeles. One is to go via the 10…
A: Given : Claim : The mean travel time via the 10 freeway, μ1, is different from μ2, the mean travel…
Q: Suppose you were going to conduct a survey of visitors to your campus. You want the survey to be as…
A:
Q: How got the answer in that column 40 and to 30% percentage
A: Given:
Q: FISHBONE DIAGRAM: Time study man in a company is experiencing a delayed delivery of parts from…
A: The total number of delayed deliveries is, The problem is the delayed delivery of parts from the…
Q: To evaluate the performance of students of a course, an instructor used a quiz worth 15%, a test…
A:
Q: 4) Give the five-number summary of the data shown in the boxplot below: 50 60 70 80
A: Boxplot is one of the graphical methods that is drawn for the quantitative variable to explain the…
Q: A major baseball league season came to an abrupt end in the middle of sporting season in 1999. In a…
A: The proportion is calculated by the random variable follows normal distribution with a sample size.…
Q: A fundraiser is offering a small gift to people making a donation. The donor can choose one of four…
A: The data shows four gifts with a mug, a t-shirt, a plush toy, and a water bottle.
Q: . A. Ventura is interested in determining what kinds and how many pets people own in Bakersfield. He…
A: Provided information is, Dr. A. Ventura is interested in determining what kinds and how many pets…
a. Use the Colley method to come up with a rating for each team, then rank them.
b. What were some of the strengths and weaknesses of this method?
Trending now
This is a popular solution!
Step by step
Solved in 2 steps with 1 images
- Answer the following, Thank you.The director of library services at a college did a survey of types of books (by subject) in the circulation library. Then she used library records to take a random sample of 888 books checked out last term and classified the books in the sample by subject. The results are shown below. Subject Area Percent of Books on Subject in CirculationLibrary on This Subject Number of Books inSample on This Subject Business 32% 247 Humanities 25% 209 Natural Science 20% 222 Social Science 15% 127 All other subjects 8% 83 Using a 5% level of significance, test the claim that the subject distribution of books in the library fits the distribution of books checked out by students. (a) What is the level of significance?State the null and alternate hypotheses. H0: The distributions are the same.H1: The distributions are different.H0: The distributions are different.H1: The distributions are different. H0: The distributions are the same.H1: The distributions are the same.H0: The…Twenty-nine college students, identified as having a positive attitude about Mitt Romney as compared to Barack Obama in the 2012 presidential election, were asked to rate how trustworthy the face of Mitt Romney appeared, as represented in their mental image of Mitt Romney’s face. Ratings were on a scale of 0 to 7, with 0 being “not at all trustworthy” and 7 being “extremely trustworthy.” Here are the 29 ratings: 2.6 3.2 3.7 3.3 3.4 3.6 3.7 3.8 3.9 4.1 4.2 4.9 5.7 4.2 3.9 3.2 4.5 5.0 5.0 4.6 4.6 3.9 3.9 5.3 2.8 2.6 3.0 3.3 3.7 a 95% confidence interval for the mean rating. Is there significant evidence at the 5% level that the mean rating is greater than 3.5 (a neutral rating)?
- The director of library services at a college did a survey of types of books (by subject) in the circulation library. Then she used library records to take a random sample of 888 books checked out last term and classified the books in the sample by subject. The results are shown below. Subject Area Percent of Books on Subject in CirculationLibrary on This Subject Number of Books inSample on This Subject Business 32% 284 Humanities 25% 218 Natural Science 20% 207 Social Science 15% 102 All other subjects 8% 77 (b) Find the value of the chi-square statistic for the sample. (Round the expected frequencies to three decimal places. Round the test statistic to three decimal places.)The director of library services at a college did a survey of types of books (by subject) in the circulation library. Then she used library records to take a random sample of 888 books checked out last term and classified the books in the sample by subject. The results are shown below. Subject Area Percent of Books on Subject in CirculationLibrary on This Subject Number of Books inSample on This Subject Business 32% 237 Humanities 25% 220 Natural Science 20% 223 Social Science 15% 128 All other subjects 8% 80 Using a 5% level of significance, test the claim that the subject distribution of books in the library fits the distribution of books checked out by students. (a) What is the level of significance?State the null and alternate hypotheses. H0: The distributions are the same.H1: The distributions are different.H0: The distributions are the same.H1: The distributions are the same. H0: The distributions are different.H1: The distributions are different.H0: The…The director of library services at a college did a survey of types of books (by subject) in the circulation library. Then she used library records to take a random sample of 888 books checked out last term and classified the books in the sample by subject. The results are shown below. Subject Area Percent of Books on Subject in CirculationLibrary on This Subject Number of Books inSample on This Subject Business 32% 267 Humanities 25% 217 Natural Science 20% 222 Social Science 15% 109 All other subjects 8% 73 Using a 5% level of significance, test the claim that the subject distribution of books in the library fits the distribution of books checked out by students. (a) What is the level of significance?State the null and alternate hypotheses. H0: The distributions are different.H1: The distributions are the same.H0: The distributions are the same.H1: The distributions are different. H0: The distributions are the same.H1: The distributions are the same.H0: The…
- Amy has two ways to travel from her home in Norco to her office in Los Angeles. One is to go via the 10 Freeway, and the other is to go via 60 Freeway. In order to determine which way she should travel on a daily basis, Amy has recorded the travel times for samples of eight trips via the 10 Freeway and eight trips via the 60 Freeway. The following table gives the travel times (in minutes) for the sixteen trips: Travel times in minutes 10 Freeway 73, 69, 72, 71, 73, 73, 72, 73 60 Freeway 80, 75, 68, 72, 73, 81, 67, 75 Assume that the two populations of travel times are normally distributed and that the population variances are equal. Can we conclude, at the 0.1 level of significance, that the mean travel times of the two routes are different? Perform a two-tailed test. Then fill in the table below. Carry your intermediate computations to at least three decimal places and round your answers as specified in the table. (If necessary, consult a list…A soap manufacturer is experimenting with several formulas of soap powder and three of the formulas were selected for further testing by a panel of homemakers. The ratings for the three formulas are as follows: Formula A: 35, 36, 44, 42, 37, 40 Formula B: 43, 44, 42, 32, 39, 41 Formula C: 46, 47, 40, 36, 45, 49 What is the sum of the ranks for Formula C? Select one: a. 78 b. 79 c. 77 d. 75 e. 80Here are some summary statistics for the numbers of hectares of olives and apples harvested per region, for area that planted those crops. In Region A, there were 36 hectares of olives harvested and 18 hectares of Apples harvested. Relative to its crop, which plant had a better harvest? A: They had equally good harvests relative to their crops. B: The Olives. C: It’s impossible to say without seeing all of the harvest amounts. D: The Apples.