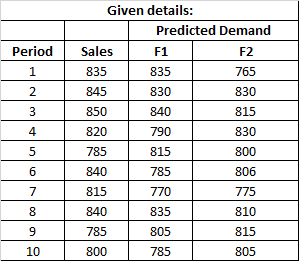
a. Compute the MSE and MAD for each forecast. (Round your answers to 2 decimal places.)
Q: The following table gives the number of pints of type A blood used at Damascus Hospital in the past…
A: Week ofPints usedAugust, 31360September, 7372September, 14412September, 21381September,…
Q: a) The forecasted demand for the week of October 12 using a 3-week moving average = 373.33 pints…
A: Week ofPrints usedAug-31360Sep-07372Sep-14412Sep-21378Sep-28368Oct-05374
Q: The monthly sales for Telco Batteries, Inc. are as follows (see image): Plot the monthly sales data…
A: MonthSales…
Q: Below is a table containing data on product demand for the most recent three months along with the…
A: MAPE - is a statistical measure of how accurate a forecast system is. It measures this accuracy as a…
Q: Ed Rogers owns an appliance store. Sales data on a particular model of a DVD player for the past six…
A: Absolute Error = | Actual sales - Forecast | MAD = Average of Absolute Error
Q: Determine the forecast results for the next 12 months using one of the following methods and provide…
A:
Q: The following table gives the number of pints of type A blood used at Damascus Hospital in the past…
A: to find:the forecast for October 12 month using a three-week moving averagethe forecast for October…
Q: Sales of tablet computers at Ted Glickman's electronics store in Washington, D.C., over the past 10…
A: Exponential smoothing is a forecasting model which considering the actual and forecasting demand…
Q: Below is a table containing data on product demand for the most recent three months along with the…
A: Mean Absolute Deviation (MAD) measures the accuracy of the prediction by the absolute value of each…
Q: Year Year Forecast (000) 1 2 3 4.00 7.00 5.00 1 5.00 Registrations (000) a) Calculate the forecasted…
A: The exponential smoothing forecast is a form of time series forecasting that is used to predict…
Q: determine the forecasts for the first four months of 2024 (January, February, March, and April)…
A: MonthSalesJan51Feb55Mar54Apr57May50Jun68Jul66Aug59Sep67Oct69Nov75Dec77
Q: Select the most suitable forecasting technique (survey, Delphi, averaging seasonal, naive, trend, or…
A: Forecasting may be a technique that uses historical knowledge as inputs to form educated estimates…
Q: Two independent methods of forecasting based on judgment and experience have been prepared each…
A: Given data is
Q: Apply the appropriate forecasting tools and techniques in predicting product demand using OM…
A: Demand forecasting is the assessment of likely future demand for an item or administration. The term…
Q: The following table gives the number of pints of type A blood used at Damascus Hospital in the past…
A: Forecasting is a process that predict the future demand using available past actual information. The…
Q: The MAD for Method 1= _____ thousand gallons (round response to three decimal places)
A: Demand is the amount of quantity of goods and services for which the people are willing to pay at…
Q: What does the word "biassed" mean when applied to a specific forecasting technique?
A: Forecasting is a common and widely used methodology in almost every area of endeavor, including…
Q: A police station had to deploy a police officer for an emergency multiple times in the last four…
A: Naive forecasting is an forecast estimation technique in which the current period forecast is equal…
Q: Develop a 3-weck weighted average forecast for Week 4 through 9 with weights WI - W2 = W3 = 0.2 0.3…
A: A moving average based on weighted average puts weight on the data gathered recently, by multiplying…
Q: Which qualitative forecasting technique was developed to ensure that the input from every…
A: Delphi method.
Q: Additional Algo 15-12 Forecasting with Seasonality Demand history for the past three years is shown…
A:
Q: i. What are the 3-months moving average forecasts for months 4, 5, 6 & 7? ii. What are the 3-month…
A: Forecasting is estimated predictions for the present as well as for the future as per the past data.…
Q: Explain what ex-post and ex-ante forecasts are, and how one can evaluate the accuracy of forecast of…
A: Ex Post Forecast, Ex Ante Forecast Ex post is forecasting using data that has been collected after…
Q: Following are two weekly forecasts made by two different me demanded at a local gasoline station.…
A: WeekForecast method 1Actual demand10.90.7221.08130.971.0741.171
Q: The MAD for Method 1 = enter your response here thousand gallons (round your response to three…
A: Forecasting is a technique used to predict future outcomes on the basis of past data. In business…
Q: Starbucks has a large, global supply chain that must efficiently supply over 17,000 stores. Although…
A: WEEK−5−4−3−2−112345678910111213Atlanta463532543433463633552820584536255541Boston59264841333534434346…
Q: Sales of tablet computers at Ted Glickman's electronics store in Washington, D.C., over the past 10…
A: Given, Week Demand 1 20 2 23 3 27 4 37 5 26 6 30 7 35 8 22 9 24 10 29…
Q: 1. Discuss the differences between Qualitative and Quantitative forecasting models. How do…
A: Since you have asked multiple questions, we will solve the first question for you. If you want any…
Q: The following table gives the number of pints of type A blood used at Damascus Hospital in the past…
A: Given data:
Q: Month 1 2 3 4 5 6 7 8 9 10 Sales 835 Forecast 1 Forecast 2 MAPE F1 MAPE F2 845 850 820 785 840 815…
A: Forecast for 10 months is provided using 2 methods:
Q: snip
A: To calculate a forecast’s percent error, the forecast error is divided by actual values.
Q: The following table shows predicted product demand using your particular forecasting method along…
A: Approach to solving the question:Rational Detailed explanation:Period 1Deviation: −50RSFE: −50Sum of…
Q: snip
A: The quantitative forecasting models are generally used for shorter-term decision making when…
Q: Calculate the MAE (or MAD).
A: Mean absolute error is a measuring unit which is used in forecasting theories. It helps in comparing…
Q: The following table gives the number of pints of type A blood used at Damascus Hospital in the past…
A: Forecasting methods help the organization in making predictions of the demand for goods and services…
Q: What is this week's forecast using trend-adjusted (double) smoothing with alpha=.5 and beta = .1, if…
A: Given, Last week forecast Ft-1= 65 Last week Actual At-1 = 50 α = 0.5 β = 0.1 Trend estimate for…
The given details below:
Trending now
This is a popular solution!
Step by step
Solved in 3 steps with 3 images
- The following table gives the number of pints of type A blood used at Damascus Hospital in the past 6 weeks: Week Of August 31 September 7 September 14 September 21 September 28 October 5 Week Of a) The forecasted demand for the week of October 12 using a 3-week moving average = pints (round your response to two decimal places). b) Using a 3-week weighted moving average, with weights of 0.10, 0.35, and 0.55, using 0.55 for the most recent week, the forecasted demand for the week October 12 pints (round your response to two decimal places and remember to use the weights in appropriate order the largest weight applies to most recent period and smallest weight applies to oldest period.) c) If the forecasted demand for the week of August 31 is 360 and a = 0.20, using exponential smoothing, develop the forecast for each of the weeks with the known demand and the forecast for the week of October 12 (round your responses to two decimal places). August 31 September 7 September 14 September 21…Here are the actual tabulated demands for an item for a nine-month period (January through September). Your supervisor wants to test two forecasting methods to see which method was better over this period. MONTH ACTUAL January 120 February 145 March 146 April 171 May 154 June 182 July 138 August 135 September 146 a. Forecast April through September using a three-month moving average. b. Use simple exponential smoothing with an alpha of 0.20 to estimate April through September, using the average of January through March as the initial forecast for April. c-1. Calculate MAD for Three-month moving average and Exponential smoothing. c-2. Use MAD to decide which method produced the better forecast over the six-month period.Jean and Dinah had been in business for two years producing umbrellas to be sold to the cruise ship passengers when they docked. They found that they are constantly out of umbrellas and had to rush producions which has resulted in the increase of their production cost. Jean has a nephew who is enrolled in the UWIOC and he advised her to prepare forecasted qualities using the sales that they made over the past months. The data below represents sales for the last 9 months. In order to assist Jean and Dinah you are asked to; a. plot the data on a graph showing the trend b. determine the equation of the trend line c. predict sales for month 10 and 11. Months Sales 1 44 2 52 3 50 4 54 5 55 6 55 7 60 8 56 9 62
- The following table shows the actual demand observed over the last 11 years: Year 1 2 3 4 5 6 7 8 9 10 11 Demand 6 8 4 7 11 7 13 12 10 13 8 This exercise contains only parts b, c, and d. Part 2 b) Using the 3-year moving average, provide the forecast from periods 4 through 12 (round your responses to one decimal place). Part 3 c) Using the 3-year weighted moving average with weights 0.10, 0.30, and 0.60, using 0.60 for the most recent period, provide the forecast from periods 4 through 12 (round your responses to two decimal places). Part 4 d) Mean absolute deviation for the forecast developed…Discuss the basic assumptions made when using time series forecasting techniques as apposed to casual techniques ?The following table gives the number of pints of type A blood used at Woodlawn Hospital in the past 6 weeks: Week Of August 31 September 7 September 14 September 21 September 28 October 5 - a) The forecasted demand for the week of October 12 using a 3-week moving average = pints (round your response to two decimal places). b) Using a 3-week weighted moving average, with weights of 0.10, 0.30, and 0.60, using 0.60 for the most recent week, the forecasted demand for the week of October 12 = pints (round your response to two decimal places and remember to use the weights in appropriate order the largest weight applies to most recent period and smallest weight applies to oldest period.) Week Of c) If the forecasted demand for the week of August 31 is 360 and a = 0.20, using exponential smoothing, develop the forecast for each of the weeks with the known demand and the forecast for the week of October 12 (round your responses to two decimal places). August 31 September 7 September 14…
- Income at the law firm of Smith and Jones for the period February to July was as follows: Month February March April May June July Income (in $ thousand) 90.0 91.5 96.0 85.4 92.2 96.0 Assume that the initial forecast for February is $85,000 and the initial trend adjustment is 0. The smoothing constants selected are a = 0.1 and ß = 0.2. Using trend-adjusted exponential smoothing, the forecast for the law firm's August income =O thousand dollars (round your response to two decimal places).Please please answer that early pleaseThe following table gives the number of pints of type A blood used at Damascus Hospital in the past 6 weeks: August 31 September 7 September 14 Week Of September 21 September 28 October 5 Week Of a) The forecasted demand for the week of October 12 using a 3-week moving average = pints (round your response to two decimal places). pints (round your b) Using a 3-week weighted moving average, with weights of 0.10, 0.35, and 0.55, using 0.55 for the most recent week, the forecasted demand for the week of October 12 = response to two decimal places and remember to use the weights in appropriate order the largest weight applies to most recent period and smallest weight applies to oldest period.) c) If the forecasted demand for the week of August 31 is 350 and x = 0.25, using exponential smoothing, develop the forecast for each of the weeks with the known demand and the forecast for the week of October 12 (round your responses to two decimal places). August 31 September 7 September 14…
- Elna inc is a microwave manufacturing and distribution company based in Jakarta. The company needs to estimate production demand using the historical sales data of the last 24 months (periods).A logistics manager of the company then uses the moving average, exponential smoothing, and simple linear regression methods to determine sales forecasts for the next 12 months (Graphically illustrate the results). Provide an analysis and the results of bias, MAPE, MSE, and MAD for the forecasting decisions.Moving average is 4 month, and alfa is 0.054. The yearly demand for units manufactured by the Orion Company Limited has been as follows:Year Units Year Units1 520 5 8602 830 6 9403 520 7 9904 750 8 850Required:i. Prepare a forecast for year 5 through 8 by using a three-year simple moving average.What is the forecast for year 9?ii. Calculate the Cumulative Frequency Error (CFE), Mean Absolute Deviation (MAD),Mean Squared Error (MSE), and Mean Absolute Percentage Error (MAPE) as at the endof year 8.Following table shows the weekly sales of smart phones at electronic retail store: Week Number of smart phones Sold Forecast using 3 period moving average Error Forecast using exponential smoothing (with α =0.4) Error 1 48 2 41 3 55 4 64 5 62 6 55 7 8 Answer the following questions based on the data given above. Show all your calculations. What is the expected sales for the 7th week based on 3 period moving average. What is the forecast for the 8th week using the same method if the actual sales for week 7 happens to be 70? What is the expected sales for the 7th week based on exponential smoothing with α = 0.3? Which of the above two forecasting method is better based on MSE? Explain why?