Month 1 2 3 4 5 6 7 8 9 10 Sales 835 Forecast 1 Forecast 2 MAPE F1 MAPE F2 845 850 820 785 840 815 840 785 800 MSE MAD Forecast 1. 835 830 840 790 815 785 770 835 MSE Tracking signal Control limits 805 785 a. Compute the MSE and MAD for each forecast. (Round your answers to 2 decimal places.) 869.44 1,250.67 Forecast 2 765 830 2.7519 % 3.4380 % MAD 0 t 815 830 b. Compute MAPE for each forecast. (Round your intermediate calculations to 5 decimal places and final answers to 4 decimal places.) 800 806 775 810 815 805 c. Prepare a naive forecast for periods 2 through 11 using the given sales data. Compute each of the following; (1) MSE, (2) MAD, (3) tracking signal at month 10, and (4) 2s control limits. (Negative values should be indicated by a minus sign. Round your answers to 2 decimal places.) -1.25 69.91 22.50 28.40
Month 1 2 3 4 5 6 7 8 9 10 Sales 835 Forecast 1 Forecast 2 MAPE F1 MAPE F2 845 850 820 785 840 815 840 785 800 MSE MAD Forecast 1. 835 830 840 790 815 785 770 835 MSE Tracking signal Control limits 805 785 a. Compute the MSE and MAD for each forecast. (Round your answers to 2 decimal places.) 869.44 1,250.67 Forecast 2 765 830 2.7519 % 3.4380 % MAD 0 t 815 830 b. Compute MAPE for each forecast. (Round your intermediate calculations to 5 decimal places and final answers to 4 decimal places.) 800 806 775 810 815 805 c. Prepare a naive forecast for periods 2 through 11 using the given sales data. Compute each of the following; (1) MSE, (2) MAD, (3) tracking signal at month 10, and (4) 2s control limits. (Negative values should be indicated by a minus sign. Round your answers to 2 decimal places.) -1.25 69.91 22.50 28.40

Practical Management Science
6th Edition
ISBN:9781337406659
Author:WINSTON, Wayne L.
Publisher:WINSTON, Wayne L.
Chapter2: Introduction To Spreadsheet Modeling
Section: Chapter Questions
Problem 20P: Julie James is opening a lemonade stand. She believes the fixed cost per week of running the stand...

Related questions
Question
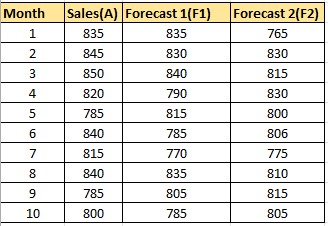
Two independent methods of forecasting based on judgment and experience have been prepared each month for the past 10 months. The forecasts and actual sales are as follows:

Transcribed Image Text:Month
1
2
3
4
5
6
7
8
9
10
Sales
835
845
Forecast 1
Forecast 2
850
820
785
840
815
840
MAPE F1
MAPE F2
785
800
Forecast 1
835
830
840
790
815
785
770
835
805
785
a. Compute the MSE and MAD for each forecast. (Round
your answers to 2 decimal places.)
MSE
MSE
MAD
Tracking signal
Control limits
869.44
1,250.67
Forecast 2
765
830
815
830
2.7519 %
3.4380 %
MAD
b. Compute MAPE for each forecast. (Round your
intermediate calculations to 5 decimal places and final
answers to 4 decimal places.)
0 ±
800
806
775
810
815
805
22.50
28.40
c. Prepare a naive forecast for periods 2 through 11 using
the given sales data. Compute each of the following; (1)
MSE, (2) MAD, (3) tracking signal at month 10, and (4) 2s
control limits. (Negative values should be indicated by a
minus sign. Round your answers to 2 decimal places.)
-1.25
69.91

Transcribed Image Text:signment i
salts alt as iviIOWS.
Month Sales
835
845
850
820
785
840
815
840
785
800
1
2
3
4
5
6
7
8
9
10
Forecast 1
Forecast 2
MAPE F1
MAPE F2
Forecast 1
835
830
840
790
815
785
770
835
805
785
MSE
MAD
MSE
Tracking signal
Control limits
Saved
869.44
1,250.67
a. Compute the MSE and MAD for each forecast. (Round
your answers to 2 decimal places.)
Forecast 2
765
830
815
2.7519 %
3.4380 %
0+
MAD
830
800
806
775
810
815
805
b. Compute MAPE for each forecast. (Round your
intermediate calculations to 5 decimal places and final
answers to 4 decimal places.)
22.50
28.40
-1.25
69.91
He p
Save & Exit Submit
c. Prepare a naive forecast for periods 2 through 11 using
the given sales data. Compute each of the following; (1)
MSE, (2) MAD, (3) tracking signal at month 10, and (4) 2s
control limits. (Negative values should be indicated by a
minus sign. Round your answers to 2 decimal places.)
Check my work
Expert Solution
Step 1: State the given information
Forecast for 10 months is provided using 2 methods:

Step by step
Solved in 6 steps with 25 images

Recommended textbooks for you
Practical Management Science
Operations Management
ISBN:
9781337406659
Author:
WINSTON, Wayne L.
Publisher:
Cengage,

Operations Management
Operations Management
ISBN:
9781259667473
Author:
William J Stevenson
Publisher:
McGraw-Hill Education

Operations and Supply Chain Management (Mcgraw-hi…
Operations Management
ISBN:
9781259666100
Author:
F. Robert Jacobs, Richard B Chase
Publisher:
McGraw-Hill Education
Practical Management Science
Operations Management
ISBN:
9781337406659
Author:
WINSTON, Wayne L.
Publisher:
Cengage,
Operations Management
Operations Management
ISBN:
9781259667473
Author:
William J Stevenson
Publisher:
McGraw-Hill Education
Operations and Supply Chain Management (Mcgraw-hi…
Operations Management
ISBN:
9781259666100
Author:
F. Robert Jacobs, Richard B Chase
Publisher:
McGraw-Hill Education


Purchasing and Supply Chain Management
Operations Management
ISBN:
9781285869681
Author:
Robert M. Monczka, Robert B. Handfield, Larry C. Giunipero, James L. Patterson
Publisher:
Cengage Learning

Production and Operations Analysis, Seventh Editi…
Operations Management
ISBN:
9781478623069
Author:
Steven Nahmias, Tava Lennon Olsen
Publisher:
Waveland Press, Inc.