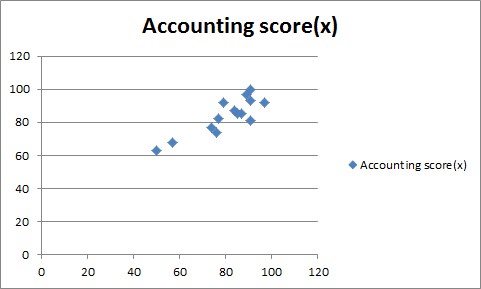
A University professor examines the relationship between 2 subjects score, those Accounting scores and Finance scores. He uses a sample data of 14 students who took Accounting and Finance tests. The following data represents student’s scores on Accounting (X) and Finance (Y). Student Accounting Score (X) Finance Score (Y) 1 97 89 2 68 57 3 85 87 4 74 76 5 92 97 6 92 79 7 100 91 8 63 50 9 85 85 10 87 84 11 81 91 12 93 91 13 77 75 14 82 77 Draw a scatter plot between Accounting and Finances scores. What could you say about the two variables relation from the scatter plot? Calculate and interpret the Spearman rank-order correlation coefficient (rho) between Accounting and Finance scores. Specify competing hypotheses in order to determine whether the Spearman correlation coefficient differs from zero.
Inverse Normal Distribution
The method used for finding the corresponding z-critical value in a normal distribution using the known probability is said to be an inverse normal distribution. The inverse normal distribution is a continuous probability distribution with a family of two parameters.
Mean, Median, Mode
It is a descriptive summary of a data set. It can be defined by using some of the measures. The central tendencies do not provide information regarding individual data from the dataset. However, they give a summary of the data set. The central tendency or measure of central tendency is a central or typical value for a probability distribution.
Z-Scores
A z-score is a unit of measurement used in statistics to describe the position of a raw score in terms of its distance from the mean, measured with reference to standard deviation from the mean. Z-scores are useful in statistics because they allow comparison between two scores that belong to different normal distributions.
A University professor examines the relationship between 2 subjects score, those Accounting scores and Finance scores. He uses a sample data of 14 students who took Accounting and Finance tests. The following data represents student’s scores on Accounting (X) and Finance (Y).
| Student | Accounting Score (X) | Finance Score (Y) |
| 1 | 97 | 89 |
| 2 | 68 | 57 |
| 3 | 85 | 87 |
| 4 | 74 | 76 |
| 5 | 92 | 97 |
| 6 | 92 | 79 |
| 7 | 100 | 91 |
| 8 | 63 | 50 |
| 9 | 85 | 85 |
| 10 | 87 | 84 |
| 11 | 81 | 91 |
| 12 | 93 | 91 |
| 13 | 77 | 75 |
| 14 | 82 | 77 |
- Draw a
scatter plot between Accounting and Finances scores. What could you say about the two variables relation from the scatter plot? - Calculate and interpret the Spearman
rank-order correlation coefficient (rho) between Accounting and Finance scores. - Specify competing hypotheses in order to determine whether the Spearman correlation coefficient differs from zero.
- At the 5% significant level, specify the critical value and decision rule.
- Are Accounting and Finance scores correlated? Explain.
Since we only answer up to 3 sub-parts, I'll answer the 1st 3 sub-parts. Please resubmit the question and specify the other subparts you'd like answered.
1)
Both variables are highly positively correlated.
2)
| Finance score(y) | Rank | Accounting score(x) | Rank | d | d^2 |
| 89 | 10 | 97 | 13 | -3 | 9 |
| 57 | 2 | 68 | 2 | 0 | 0 |
| 87 | 9 | 85 | 7.5 | 1.5 | 2.25 |
| 76 | 4 | 74 | 3 | 1 | 1 |
| 97 | 14 | 92 | 10.5 | 3.5 | 12.25 |
| 79 | 6 | 92 | 10.5 | -4.5 | 20.25 |
| 91 | 13 | 100 | 14 | -1 | 1 |
| 50 | 1 | 63 | 1 | 0 | 0 |
| 85 | 8 | 85 | 7.5 | 0.5 | 0.25 |
| 84 | 7 | 87 | 9 | -2 | 4 |
| 91 | 11.5 | 81 | 5 | 6.5 | 42.25 |
| 91 | 11.5 | 93 | 12 | -0.5 | 0.25 |
| 74 | 3 | 77 | 4 | -1 | 1 |
| 77 | 5 | 82 | 6 | -1 | 1 |
Step by step
Solved in 4 steps with 1 images


