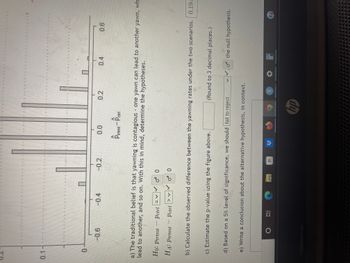
An experiment tested if a person can be subconsciously influenced into yawning if another person near them yawns. 50 people were randomly assigned to two groups: 34 to a group where a person near them yawned (treatment) and 16 to a group where there wasn't a person yawning near them (control). The following table shows the results of this experiment. Treatment Control Total Yawn 13 3 16 Not Yawn 21 13 34 Total 34 16 50 A simulation was conducted to understand the distribution of the difference in sample statistics under the assumption that having someone yawn near another person has no influence on if the other person will yawn. In order to conduct the simulation, a researcher wrote yawn on 14 index cards and not yawn on 36 index cards to indicate whether or not a person yawned. Then he shuffled the cards and dealt them into two groups of size 34 and 16 for treatment and control, respectively. He counted how many participants in each simulated group yawned, and calculated the difference between the simulated proportions of yawning as ˆptrtmt−ˆpctrlp^trtmt-p^ctrl. This simulation was repeated 10,000 times using software to obtain 10,000 differences that are due to chance alone. The histogram shows the distribution of the simulated differences. b) Calculate the observed difference between the yawning rates under the two scenarios. c) Estimate the p-value using the figure above. (Round to 3 decimal places.) d) Based on a 5% level of significance, we should Select an answer reject fail to reject the null hypothesis. e) Write a conclusion about the alternative hypothesis, in context.
Addition Rule of Probability
It simply refers to the likelihood of an event taking place whenever the occurrence of an event is uncertain. The probability of a single event can be calculated by dividing the number of successful trials of that event by the total number of trials.
Expected Value
When a large number of trials are performed for any random variable ‘X’, the predicted result is most likely the mean of all the outcomes for the random variable and it is known as expected value also known as expectation. The expected value, also known as the expectation, is denoted by: E(X).
Probability Distributions
Understanding probability is necessary to know the probability distributions. In statistics, probability is how the uncertainty of an event is measured. This event can be anything. The most common examples include tossing a coin, rolling a die, or choosing a card. Each of these events has multiple possibilities. Every such possibility is measured with the help of probability. To be more precise, the probability is used for calculating the occurrence of events that may or may not happen. Probability does not give sure results. Unless the probability of any event is 1, the different outcomes may or may not happen in real life, regardless of how less or how more their probability is.
Basic Probability
The simple definition of probability it is a chance of the occurrence of an event. It is defined in numerical form and the probability value is between 0 to 1. The probability value 0 indicates that there is no chance of that event occurring and the probability value 1 indicates that the event will occur. Sum of the probability value must be 1. The probability value is never a negative number. If it happens, then recheck the calculation.
An experiment tested if a person can be subconsciously influenced into yawning if another person near them yawns. 50 people were randomly assigned to two groups: 34 to a group where a person near them yawned (treatment) and 16 to a group where there wasn't a person yawning near them (control). The following table shows the results of this experiment.
| Treatment | Control | Total | |
| Yawn | 13 | 3 | 16 |
| Not Yawn | 21 | 13 | 34 |
| Total | 34 | 16 | 50 |
A simulation was conducted to understand the distribution of the difference in sample statistics under the assumption that having someone yawn near another person has no influence on if the other person will yawn. In order to conduct the simulation, a researcher wrote yawn on 14 index cards and not yawn on 36 index cards to indicate whether or not a person yawned. Then he shuffled the cards and dealt them into two groups of size 34 and 16 for treatment and control, respectively. He counted how many participants in each simulated group yawned, and calculated the difference between the simulated proportions of yawning as ˆptrtmt−ˆpctrlp^trtmt-p^ctrl. This simulation was repeated 10,000 times using software to obtain 10,000 differences that are due to chance alone. The histogram shows the distribution of the simulated differences.
b) Calculate the observed difference between the yawning rates under the two scenarios.
c) Estimate the p-value using the figure above. (Round to 3 decimal places.)
d) Based on a 5% level of significance, we should Select an answer reject fail to reject the null hypothesis.
e) Write a conclusion about the alternative hypothesis, in context.

Trending now
This is a popular solution!
Step by step
Solved in 2 steps


