A study was conducted to determine how people get jobs. The table Iists data from 400 randomiy selected subjects. Construct aJob Sources Pareto chart that comresponds to the given data. If someone wouid ike to get a joo. what seems to be the most effective approach? Frequency 26 Help-wanted ads (H) Executive search firms (E) Networking (N) Mass mailing (M) ifs 56 45 273 Choose the correct Pareto char OA OB. OD. 300 300 300 L L. 250 200 150 250- 50 200 300 150- 100 100- 50 HENM MENH if someone would like to get a job, what seems to be the most effectve aoproch
A study was conducted to determine how people get jobs. The table Iists data from 400 randomiy selected subjects. Construct aJob Sources Pareto chart that comresponds to the given data. If someone wouid ike to get a joo. what seems to be the most effective approach? Frequency 26 Help-wanted ads (H) Executive search firms (E) Networking (N) Mass mailing (M) ifs 56 45 273 Choose the correct Pareto char OA OB. OD. 300 300 300 L L. 250 200 150 250- 50 200 300 150- 100 100- 50 HENM MENH if someone would like to get a job, what seems to be the most effectve aoproch

MATLAB: An Introduction with Applications
6th Edition
ISBN:9781119256830
Author:Amos Gilat
Publisher:Amos Gilat
Chapter1: Starting With Matlab
Section: Chapter Questions
Problem 1P

Related questions

Topic Video
Question

Transcribed Image Text:A study was conducted to determine how people get jobs. The table lsts data from 400 randomly selected subjects Construct aJob Sources
Pareto chart that corresponds to the given data. If someone would like to get a job, what seems to be the most effective
Frequency
Help-wanted ads (H)
Executive search firms (E)
26
56
45
approach?
Networking (N)
Mass mailing (M)
273
Choose the corrct Pareto chart.
OA.
OB.
OC.
OD.
300
250
300
300-
250-
200
300
(290
200
150
100-
50
200-
150
100
50-
HENM
(0-
MENH
If someone would like to get a job, what seems to be the most offective aopronch?
Click to select your ansvwer.

Transcribed Image Text:O iete
A study was conducted to determine how people get jobs. The table lists data from 400 randomly selected subjects. Construct aJob Sources
Pareto chart that coresponds to the given data. If someone would like to get a job, what seems to be the most effective
approach?
Help-wanted ads (H)
Executive search firms (E)
Networking (N)
Mass mailing (M)
Frequency
26
56
45
273
200-
150
100
50
200-
150-
100-
50-
200
200-
150
300-
5o-
150
100
50
N M
0-
TENH
HEN
MEN
If someone would like to get a job, what seems to be the most effective approach?
lete
OA Executive search firmms (E)
OB. Help-wanted ads (H)
OC Mass maling (M)
OD. Networking (N)
Click to select your answer.
Us I
Expert Solution
Step 1
1) Given Information:
| Job sources | Frequency |
| Help-wanted ads (H) | 26 |
| Executive search firms (E) | 56 |
| Networking (N) | 45 |
| Mass mailing (M) | 273 |
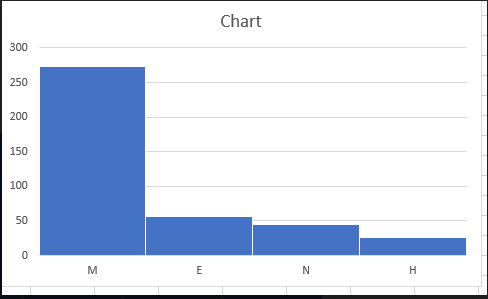
Using Excel Pareto chart can be obtained as follows:
Enter the data in Excel sheet, sort the data (largest to smallest) by frequency.
Select the data, go to Insert.
Under different chart types, select Bar/column chart.
Excel output is given below:

Trending now
This is a popular solution!

Step by step
Solved in 2 steps with 1 images

Knowledge Booster


Learn more about
Need a deep-dive on the concept behind this application? Look no further. Learn more about this topic, statistics and related others by exploring similar questions and additional content below.Recommended textbooks for you
MATLAB: An Introduction with Applications
Statistics
ISBN:
9781119256830
Author:
Amos Gilat
Publisher:
John Wiley & Sons Inc

Probability and Statistics for Engineering and th…
Statistics
ISBN:
9781305251809
Author:
Jay L. Devore
Publisher:
Cengage Learning

Statistics for The Behavioral Sciences (MindTap C…
Statistics
ISBN:
9781305504912
Author:
Frederick J Gravetter, Larry B. Wallnau
Publisher:
Cengage Learning
MATLAB: An Introduction with Applications
Statistics
ISBN:
9781119256830
Author:
Amos Gilat
Publisher:
John Wiley & Sons Inc
Probability and Statistics for Engineering and th…
Statistics
ISBN:
9781305251809
Author:
Jay L. Devore
Publisher:
Cengage Learning
Statistics for The Behavioral Sciences (MindTap C…
Statistics
ISBN:
9781305504912
Author:
Frederick J Gravetter, Larry B. Wallnau
Publisher:
Cengage Learning

Elementary Statistics: Picturing the World (7th E…
Statistics
ISBN:
9780134683416
Author:
Ron Larson, Betsy Farber
Publisher:
PEARSON

The Basic Practice of Statistics
Statistics
ISBN:
9781319042578
Author:
David S. Moore, William I. Notz, Michael A. Fligner
Publisher:
W. H. Freeman

Introduction to the Practice of Statistics
Statistics
ISBN:
9781319013387
Author:
David S. Moore, George P. McCabe, Bruce A. Craig
Publisher:
W. H. Freeman