A study from 2014 found that adults in the US spend an average of 11 hours per day watching, reading, listening to or simply interacting with media. Researchers at UCLA suspect students spend less time engaging media. They grouped UCLA students by class section, randomly selected 20 class sections, and administered a survey to each student in those randomly selected class sections. The following data represents the mean time (in hours) per day spent engaging media for each of the randomly selected classes: 9.5 11.5 6.0 7.5 8 9.5 10.5 11 12 8.2 5 9.5 8.2 9.3 10.8 11 13 8.6 9.5 10.5 What would be the interval interpreted from a 99% Confidence Interval for mean time (in hours) spent per day engaging media for UCLA students.
A study from 2014 found that adults in the US spend an average of 11 hours per day watching, reading, listening to or simply interacting with media. Researchers at UCLA suspect students spend less time engaging media. They grouped UCLA students by class section, randomly selected 20 class sections, and administered a survey to each student in those randomly selected class sections. The following data represents the
| 9.5 | 11.5 | 6.0 | 7.5 | 8 | 9.5 | 10.5 | 11 | 12 | 8.2 |
| 5 | 9.5 | 8.2 | 9.3 | 10.8 | 11 | 13 | 8.6 | 9.5 | 10.5 |
What would be the interval interpreted from a 99% Confidence Interval for mean time (in hours) spent per day engaging media for UCLA students.
Let µ be the true average time per day watching, reading, listening to or simply interacting with media. Here the sample size is 20 that is less than 30 and the population standard deviation is unknown. Hence, z test cannot be used t test can be used.
Confidence interval:
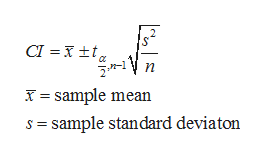
The 100(1-α)% confidence interval for the mean is,

Degrees of freedom:
n-1 = 20-1 =19.
Critical value:
The level of significance is 0.01.
α =0.01. α/2 =0.005. 1-(α/2) =0.995.
Using the Excel formula, ‘=T.INV.2T(0.01,19)’, the critical values are ±2.86.
Step by step
Solved in 6 steps with 2 images


