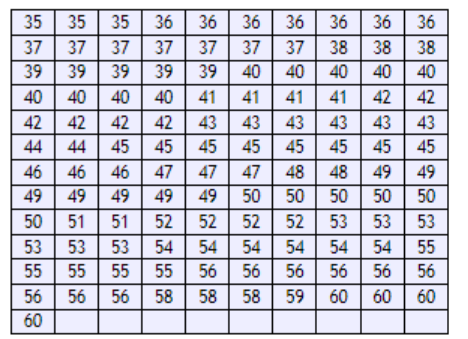
A random sample of 121 CEOS is selected to determine the number who are less than 39 years old. The ages below are from the sample taken. 35 35 35 36 36 36 36 36 36 36 37 37 37 37 37 37 37 38 38 38 39 39 39 39 39 40 40 40 40 40 40 40 40 40 41 41 41 41 42 42 42 42 42 42 43 43 43 43 43 43 44 44 45 45 45 45 45 45 45 45 46 46 46 47 47 47 48 48 49 49 49 49 49 49 49 50 50 50 50 50 50 51 51 52 52 52 52 53 53 53 53 53 53 54 54 54 54 54 54 55 55 55 55 55 56 56 56 56 56 56 56 56 56 58 58 58 59 60 60 60 60 a) How many CEOS are less than 39? (Enter as integer) b) How many CEOS are in the sample? |(Enter as integer) c) What is the p value for the sample? (Round to four decimal places)
Q: Women Men Total Under 30 30 8 38 30 to 50 25 14 39 50 & over 18 5 23 Totals 73 27 100 17. A…
A: Solution: Note: Hello! As you have posted more than 3 sub parts, we are answering the first 3…
Q: The International Air Transport Association surveys business travelers to develop quality ratings…
A: Obtain the mean and standard deviation of ratings for the random sample of 50 business travelers of…
Q: 14) The test scores of 32 students are listed below. Construct a boxplot for the data set. 32 37 41…
A: Given that ; A data set is given and by using this data we find a five number summary then make a…
Q: 7 Consider the data set below representing marks of students in a test. 25 45 20 16 18 39 33 51 13…
A: Given information: The data set representing the marks of students in a test is: 25 45 20 16 18…
Q: Do all possible ways to put meaning into the given sets of data as follows: Entrance test results of…
A:
Q: ty students were given a history exam. Their scores are shown below, sorted from smallest to large 6…
A: Given data indicates the scores of 60 students in a history exam.
Q: In a two-week study of the productivity of 100 workers, the following data was obtained on the total…
A: Frequency table: It shows the list of observation and how many times the no each observation occurs…
Q: The following data represents the age of 30 lottery winners. 22 25 26 27 28 30 34 37 43 46 47 51 56…
A: We count the frequencies for the given class Intervals. As there are 5 Observations between 20 and…
Q: According to Scarborough Research, more than 85% of working adults commute by car. Of all U.S.…
A: Given that, According to Scarborough Research, more than 85% of working adults commute by car. Of…
Q: The following data lists the ages of a random selection of actresses when they won an award in the…
A: The actresses are selected randomly and the age at which they won the best actress award are noted…
Q: A group conducted a study of the calorie content of different types of beer. The calorie content…
A: Given data, 26,38,33,27,39,43,31,27,25,33,22,43,42,35,26,38,33,24,19,27,31,34,39,42,31,32 Sort the…
Q: To be classified as a master, a student must successfully execute 55 or more consecutive sit-ups. 1.…
A:
Q: 49 55 39 37 44 47 44 32 38 53 46 26 46 46 37 45 39 38 33 48 46 66 48 44 59 45 54 56 41 44 31 53 35…
A: NOTE: As per the guidelines, we are supposed to solve the first three subparts only.a). Ungrouped:…
Q: The test scores of 40 students are listed below. Find P56. 30 35 43 44 47 48 54 55 56 57 59 62 63 65…
A: percentile is a generalized form of the quartiles. it can be defines as the value below which a…
Q: A magazine published data on the best small firms in a certain year. These were firms that had been…
A: Sample size (n) = 30Confidence level = 90%
Q: The serum cholesterol levels of 50 subjects randomly selected from the LA. Heart Data, data from a…
A: Solution: n = 50 Sample size ∑x =12339x =∑x n=1233950=246.78 Sample mean s= ∑(x-x)2n-1s =47.3119…
Q: Written exam grades of students in a class are given below. NOTE: 55; 60; 65; 75; 90; 95; 90; 80;…
A: When data is given by a set containing the data points, then it is termed as raw data. To analysis…
Q: 1) what proportion of students scored above student 33 on homework 3? 2) what proportion of students…
A: Given: Student ID HW 1 HW 2 HW 3 1 98 93 99 2 81 80 64 3 66 91 75.5 4 84 94 80 5 65…
Q: The following joint frequency distribution table shows responses from a sample of 203 unionized…
A: Age groupApproveDisapproveIndifferentTotalUnder 251722276625 to 402521551Over…
Q: Construct the frequency distribution. Compute the relative frequency distribution. Construct the…
A: 1. The frequency for each class interval is obtained by counting the number of data values that lie…
Q: A desk lamp produced by The Luminar Company was found to be defective (D). There are three factories…
A:
Q: Construct the Box-plot of the ages of the 100 employees.
A: Use Excel (Mega stat) steps to construct the box plot of the ages of the 100 employees as follows:…
Q: The following data represents the age of 30 lottery winners. 24 28 28 33 35 36 39 41 42 45 45 45 46…
A:
Q: 5. Recall that 60 randomly selected shoppers have rated a new bottle design for a popular soft…
A: Given information: 34, 33, 33, 29, 26, 32, 25, 27, 33, 22, 24, 30, 20, 34, 31, 32, 28, 30, 31, 31,…
Q: Out of a student group of 85 people, 39 people play basketball, 42 people play football and 25…
A: Introduction: Define the following events: B: Plays basketball; F: Plays football; T: Plays tennis;…
Q: None
A: This is the histogram according to the ages of voters given. It contains five classes, with a lower…
Q: Do the test scores seem to be skewed? Yes or No? If so, in what direction? (positive or negative?)
A: When the mode of the distribution is in right side of the bell curve, then it is called left skewed.…
Q: The following data lists the ages of a random selection of actresses when they won an award in the…
A: Let d denote the actress's age minus the actors age Let μd denote the mean value of the difference d…
Q: The following data lists the ages of a random selection of actresses when they won an award in the…
A: Let d be a random variable, defined as the difference between the Age of the Actress who won the…
Q: (e) Determine the z-score of the second lowest and the second highest grades among the population.…
A: Given data, Data 23 60 79 32 57 74 52 70 82 36 80 77 81 95 41 65…
Q: Let the five numbers 3, 4, 5, 6, 7 constitute a universe. Select all samples of size three. Compute…
A:
Q: 3. The list shows the ages of 25 adults selected at random from the audience of a jazz band concert…
A:
Q: O Midland National Bank selected a sample of 40 student checking accounts. Below are their…
A: The data of 40 student checking account balance is,SR…
Q: A random sample of 12 pledges to a public radio fundraiser revealed the following dollar pledges: 75…
A: Range of a data set is the difference between the maximum and the minimum value. It is obtained by…
Q: The following data represents the age of 30 lottery winners. 22 30 33 33 36 40 41 42 49 50 57 58 59…
A: The data are…
Q: Provide an appropriate response. 9) In a survey, 26 voters were asked their ages. The results are…
A: Class Intervals:20 - 2930 - 3940 - 4950 - 5960 - 69Next, we count the number of voters (frequencies)…
Q: Here is a sample of the number of cars passing over a bridge per hour during rush hour. 404 408 409…
A: Given The data is as follows: 404, 432, 452, 456, 461, 464, 471, 484, 499, 408, 433, 452, 456, 461,…
Q: No. Age 1 32 2 21 3 22 4 39 5 21 6 21 7 20 8 22 9 38 10 36 11 22 12 35 13 21 14 20 15 32 16 21 17…
A: (1) Obtain the frequency distribution table. The frequency table is obtained below as follows: The…
Q: In a study of how chief executive officers (CEOs) spend their days, it was found that CEOs spend an…
A: A frequency distribution is a tabular, listed or graphical representation of data that shows the…
Q: mpty. If your answer is "zero" enter "0". 68 35 63 33 21
A: In order to find the all the stems and associated leaves, it is useful to put the data in ascending…
Q: Sixty students were given a history exam. Their scores are shown below, sorted from smallest to…
A: Five number summary is: Min, Q1, Median, Q3 , Max Here minimum observation is 16 so Min= 16…
Q: ) 9 (3X+4)-2X=11+5(4X-1)
A:
Q: Sixteen men and fourteen women in an Introductory Psychology class have taken their midterm exams.…
A:
Q: The following data represents the age of 30 lottery winners. 20 33 34 35 44 45 52 52 55 56 56 59 61…
A: We have given that data I want to make frequency table .
Q: In a study conducted by some Statistics students, 71 people were randomly assigned to listen to rap…
A: Given, For Mozart: nM = 23x¯M = 8.04sM = 3.32 For Rap: nR = 31x¯R = 11.61sR = 4.48 To find, Does…
The given data set is,
(a)
The number of CEO's are less than 39 is,x= 20
Step by step
Solved in 2 steps with 2 images
- 1. Construct frequency distribution table based on the scores of 75 randomly selected students. 37 35 49 42 46 37 26 30 46 45 27 38 302 47 30 43 C. D. 33 42 42 Scores 29 38 26 31 42 26 to 30 31 to 35 36 to 40 41 to 45 46 to 50 Total 41 26 45 31 41 28 49 29 34 46 50 38 35 43 34 38 39 39 43 41 39 31 Frequency 13 10 16 44 48 43 37 18 18 39 75 46 46 45 36 28 32 46 36 48 43 37 39 26 46 38 46 48 48 50 17.33% Percentage (%) 13.33% 21.33% 24% 42 24% 100% 27 50 45 31 A. Based on the frequency distribution, compute measures of central tendency, measures of variation, Skewness and kurtosis. B. Based on the raw data, compute measures of central tendency, measures of variation, Skewness and kurtosis using Excel. Based on the computed value of skewness and kurtosis in A and B, describe the shape of the distribution. Do you think that computed value for grouped and ungrouped data are the same?Suppose a researcher is interested determining whether on average, driving times on the major traffic routes are approximately the same. The following data are randomly collected from three major traffic routes.The entries in the table are drivings times in minutes on the these routes. Route 1 Route 2 Route 3 45 39 41 42 40 40 46 39 41 43 40 42 43 39 43 43 39 43 43 41 40 43 38 40 48 41 41 45 39 43 39 40 39 40 46 43 40 41 40 42 40 40 46 46 41 A One-Way ANOVA test was conducted at a 0.02 level of significance. The results are shown below. Note that some values in the table might be in scientific notation. Say, 1.65E-07 means 1.65x10⁻⁷ or 0.000000165.ANOVA: Single Factor SUMMARY Groups Count Sum Average Variance Route 1 10 441 44.100 3.433333 Route 2 15 599 39.933 3.495238 Route 3 20 833 41.650 3.502632 ANOVA Source of Variation SS df MS F P-value F crit Between Groups 104.19444…40 The top 20 quarterbacks in the NFL with the most Touchdowns (TD) in the 2020 season were selected The data comes from a normally distributed population. Player TD Aaron Rodgers 48 Russell Wilson Tom Brady 40 38 Patrick Mahomes Josh Allen 37 Kirk Cousins 35 Deshaun Watson 33 Ryan Tannehill 33 Ben Roethlisberger 33 Justin Herbert Derek Carr 27 Matthew Stafford Matt Ryan 26 Kyler Murray Baker Mayfield Lamar Jackson Philip Rivers 24 Drew Brees 24 33,35,37,38, 40ot 40+48 Jared Goff Carson Wentz 1) Data Analysis – Find the following rounding answers to the whole number when necess: Mean: 30 Median: Mode: Midrange: Range: Standard Deviation:
- In a study conducted by some Statistics students, 71 people were randomly assigned to listen to rap music, music by Mozart, or no music while attempting to memorize objects pictured on a page. They were then asked to list all the objects they could remember. The summary statistics for each group are shown in the table. Complete parts a and b. Rap 23 Mozart No Music Count Mean SD 31 17 11.61 8.04 13.92 4.84 4.48 3.32 Let group M correspond to Mozart listeners and group R correspond to rap listeners. Write the null and alternative hypotheses. Choose the correct answer below. O A Ho Hu - He =0 HA: HM- HR#0 B. Ho: HM-HR =0 HA HM HR 0 OC. Ho Hu- HRThe table below contains the periodontal status of individuals and their sex. Periodontal status refers to gum disease where individuals are classified as either Healthy, have Gingivitis, or have Periodontal Disease (Perio). Female Male Total Healthy 2108 1124 3232 Gingivitis 1582 937 2519 Perio 873 931 1804 Total 4563 2992 7555 Find Pr{Female or Gingivitis). If necessary, round your answer to 3 places after the decimal.The table below gives the number of suicides estimated in the U.S. for a recent year by age, race (black or white), and sex. We are interested in possible relationships between age, race, and sex. We will let suicide victims be our population. Race and Sex 1-14 15-24 25-64 over 64 TOTALS white, male 210 3,360 13,610 22,050 white, female 75 585 3,385 4,930 black, male 10 460 1,065 1,670 black, female 0 45 265 330 all others TOTALS 310 4,650 18,780 29,760The test scores of 56 students in Mathematics are the following: Вoys: 72 75 92 86 74 80 71 78 90 85 75 74 81 76 86 81 90 89 88 85 92 92 87 90 87 93 94 94 Girls: 89 88 73 81 89 74 74 76 86 74 75 88 78 79 75 76 76 96 87 75 71 78 72 71 71 74 74 71 Determine the following: Median = Q1 = Q3 = D9 =The following data represents the age of 30 lottery winners. 22 29 34 37 39 39 42 42 42 43 44 46 46 49 49 52 55 61 63 65 67 68 68 69 74 75 75 77 79 88 Complete the frequency distribution for the data. Bin Frequency [20,30) [30,40) [40,50) [50,60) [60,70) [70,80) [80,90)A local bookstore arranges book counter in different schools around the year. The CEO says that, compare to last year, the number of orders received in school has been dropped this year. The table below shows the number of orders received in a random sample of 14 schools in this year and last year. School 1 3 4 6. 8. 9. 10 11 12 13 14 This year 85 35 96 45 33 52 67 77 45 67 43 76 80 65 Last year 92 38 93 81 42 50 61 89 56 63 49 65 92 81 Test, at 5% level of significance, is there sufficient evidence to conclude that the CEO's statement is correct. (The test report must include (i) null hypothesis and alternative hypothesis, (ii) rejection region, (iii) calculation of test statistics, and (iv) conclusion.)A random sample of 30 large companies in the united states shows the amount in million of dollars , that each company donated to charity For a specific year. Construct a frequency distribution for the data using 9 classes . 26 25 19 31 14 48 35 43 25 46 17 21 57 58 34 41 12 27 15 53 16 63 82 23 52 56 75 19 26 88In recent year, 28 US States had one or more tribal gambling casinos. The following table presents the number of tribal gambling casinos in those states.3 2 26 70 2 2 87 3 4 3 22 39 314 7 3 21 8 2 11114 8 14 1 34 31 4 Find the 5-number summaryConstruct a boxplot for these dataA 2012 study of freely forming groups in bars all over Europe examined the natural behavior of groups. The researchers recorded the group size (number of individuals in the group) of all 501 groups in the study that were naturally laughing. The findings were displayed in the figure below. 300 Number of groups 250 200 O 52 O 2.7 0 2 150 3.5 4 100 50 0 254 2 Enter your answer here The median laughter group size in this study is 168 3 The mean laughter group size in this study is O 100.2 Enter your answer here 52 4 5 Laughter group size 21 6 6 Can we conclude from these findings that, in European bars in 2012, smaller groups were more likely than larger groups to be naturally laughing? Explain your statistical reasoning in one sentence.SEE MORE QUESTIONS