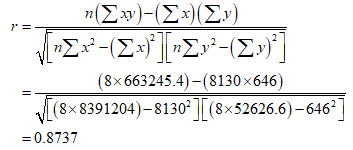
a) Find the value of the line ar correlation coefficient r b) Find the eritical values ofr from table A-6 using x= 0.05 c) Determine whether there is sufficient evidence to support a claim of a linear correlation Between the two variables. d) Find the regression equation, e) Letting the first variable be the predictor (x) variable, find the indicated predicted value.


Correlation
Correlation defines a relationship between two independent variables. It tells the degree to which variables move in relation to each other. When two sets of data are related to each other, there is a correlation between them.
Linear Correlation
A correlation is used to determine the relationships between numerical and categorical variables. In other words, it is an indicator of how things are connected to one another. The correlation analysis is the study of how variables are related.
Regression Analysis
Regression analysis is a statistical method in which it estimates the relationship between a dependent variable and one or more independent variable. In simple terms dependent variable is called as outcome variable and independent variable is called as predictors. Regression analysis is one of the methods to find the trends in data. The independent variable used in Regression analysis is named Predictor variable. It offers data of an associated dependent variable regarding a particular outcome.


Since you have asked multiple sub parts of the question, we will solve first three sub parts for you. If you want any specific question to be solved then please specify the question number or post only that question.
Sample size = n = 8.
Let, X : Chirps in 1 minute, Y : Temperature.
| x | y | xy | x2 | y2 |
| 882 | 69.7 | 61475.4 | 777924 | 4858.09 |
| 1188 | 93.3 | 110840.4 | 1411344 | 8704.89 |
| 1104 | 84.3 | 93067.2 | 1218816 | 7106.49 |
| 864 | 76.3 | 65923.2 | 746496 | 5821.69 |
| 1200 | 88.6 | 106320 | 1440000 | 7849.96 |
| 1032 | 82.6 | 85243.2 | 1065024 | 6822.76 |
| 960 | 71.6 | 68736 | 921600 | 5126.56 |
| 900 | 79.6 | 71640 | 810000 | 6336.16 |
a)

Step by step
Solved in 4 steps with 1 images


