A data set includes data from student evaluations of courses. The summary statistics are n=95, x= 3.33, s=0.66. Use a 0.10 significance level to test the claim that the population of student course evaluations has a mean equal to 3.50. Assume that a simple random sample has been selected. Identify the null and alternative hypotheses, test statistic, P-value, and state the final conclusion that addresses the original claim. What are the null and alternative hypotheses? O A. Hp: H=3.50 H:u<3.50 О в. Но: и3.50 H: u23.50 OC. Ho: Hz3.50 H:p=3.50 OD. Ho: =3.50 H: u>3.50 Determine the test statistic. (Round to two decimal places as needed.) Determine the P-value. (Round three decimal places as needed.) State the final conclusion that addresses the original claim. v Ho. There is v evidence to conclude that the mean of the population of student course evaluations is equal to 3.50 v correct.
A data set includes data from student evaluations of courses. The summary statistics are n=95, x= 3.33, s=0.66. Use a 0.10 significance level to test the claim that the population of student course evaluations has a mean equal to 3.50. Assume that a simple random sample has been selected. Identify the null and alternative hypotheses, test statistic, P-value, and state the final conclusion that addresses the original claim. What are the null and alternative hypotheses? O A. Hp: H=3.50 H:u<3.50 О в. Но: и3.50 H: u23.50 OC. Ho: Hz3.50 H:p=3.50 OD. Ho: =3.50 H: u>3.50 Determine the test statistic. (Round to two decimal places as needed.) Determine the P-value. (Round three decimal places as needed.) State the final conclusion that addresses the original claim. v Ho. There is v evidence to conclude that the mean of the population of student course evaluations is equal to 3.50 v correct.

MATLAB: An Introduction with Applications
6th Edition
ISBN:9781119256830
Author:Amos Gilat
Publisher:Amos Gilat
Chapter1: Starting With Matlab
Section: Chapter Questions
Problem 1P

Related questions
Question
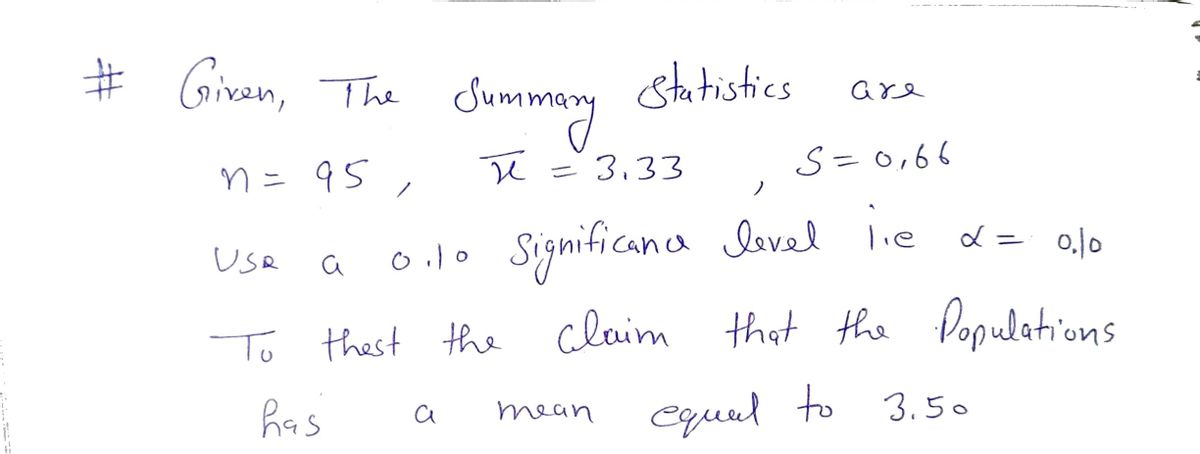
![A data set includes data from student evaluations of courses. The summary statistics are \( n=95 \), \( \bar{x}=3.33 \), \( s=0.66 \). Use a 0.10 significance level to test the claim that the population of student course evaluations has a mean equal to 3.50. Assume that a simple random sample has been selected. Identify the null and alternative hypotheses, test statistic, P-value, and state the final conclusion that addresses the original claim.
**What are the null and alternative hypotheses?**
- **A.** \( H_0: \mu = 3.50 \)
\( H_1: \mu < 3.50 \)
- **B.** \( H_0: \mu = 3.50 \)
\( H_1: \mu \neq 3.50 \)
- **C.** \( H_0: \mu = 3.50 \)
\( H_1: \mu > 3.50 \)
- **D.** \( H_0: \mu \neq 3.50 \)
\( H_1: \mu = 3.50 \)
---
**Determine the test statistic.**
\[
\text{(Round to two decimal places as needed.)}
\]
**Determine the P-value.**
\[
\text{(Round to three decimal places as needed.)}
\]
**State the final conclusion that addresses the original claim.**
\( H_0 \). There is \(\underline{\quad}\) evidence to conclude that the mean of the population of student course evaluations is equal to 3.50 \(\underline{\quad}\) correct.](/v2/_next/image?url=https%3A%2F%2Fcontent.bartleby.com%2Fqna-images%2Fquestion%2Fc0140bc0-2ff4-45eb-a192-fee1e619b6ab%2Ff8aed5fe-8258-441e-af51-0e68d3b51e38%2Ftk2as9u_processed.png&w=3840&q=75)
Transcribed Image Text:A data set includes data from student evaluations of courses. The summary statistics are \( n=95 \), \( \bar{x}=3.33 \), \( s=0.66 \). Use a 0.10 significance level to test the claim that the population of student course evaluations has a mean equal to 3.50. Assume that a simple random sample has been selected. Identify the null and alternative hypotheses, test statistic, P-value, and state the final conclusion that addresses the original claim.
**What are the null and alternative hypotheses?**
- **A.** \( H_0: \mu = 3.50 \)
\( H_1: \mu < 3.50 \)
- **B.** \( H_0: \mu = 3.50 \)
\( H_1: \mu \neq 3.50 \)
- **C.** \( H_0: \mu = 3.50 \)
\( H_1: \mu > 3.50 \)
- **D.** \( H_0: \mu \neq 3.50 \)
\( H_1: \mu = 3.50 \)
---
**Determine the test statistic.**
\[
\text{(Round to two decimal places as needed.)}
\]
**Determine the P-value.**
\[
\text{(Round to three decimal places as needed.)}
\]
**State the final conclusion that addresses the original claim.**
\( H_0 \). There is \(\underline{\quad}\) evidence to conclude that the mean of the population of student course evaluations is equal to 3.50 \(\underline{\quad}\) correct.
Expert Solution
Step 1

Step by step
Solved in 2 steps with 2 images

Recommended textbooks for you
MATLAB: An Introduction with Applications
Statistics
ISBN:
9781119256830
Author:
Amos Gilat
Publisher:
John Wiley & Sons Inc

Probability and Statistics for Engineering and th…
Statistics
ISBN:
9781305251809
Author:
Jay L. Devore
Publisher:
Cengage Learning

Statistics for The Behavioral Sciences (MindTap C…
Statistics
ISBN:
9781305504912
Author:
Frederick J Gravetter, Larry B. Wallnau
Publisher:
Cengage Learning
MATLAB: An Introduction with Applications
Statistics
ISBN:
9781119256830
Author:
Amos Gilat
Publisher:
John Wiley & Sons Inc
Probability and Statistics for Engineering and th…
Statistics
ISBN:
9781305251809
Author:
Jay L. Devore
Publisher:
Cengage Learning
Statistics for The Behavioral Sciences (MindTap C…
Statistics
ISBN:
9781305504912
Author:
Frederick J Gravetter, Larry B. Wallnau
Publisher:
Cengage Learning

Elementary Statistics: Picturing the World (7th E…
Statistics
ISBN:
9780134683416
Author:
Ron Larson, Betsy Farber
Publisher:
PEARSON

The Basic Practice of Statistics
Statistics
ISBN:
9781319042578
Author:
David S. Moore, William I. Notz, Michael A. Fligner
Publisher:
W. H. Freeman

Introduction to the Practice of Statistics
Statistics
ISBN:
9781319013387
Author:
David S. Moore, George P. McCabe, Bruce A. Craig
Publisher:
W. H. Freeman