7 x С 2 6 5 3 B
A First Course in Probability (10th Edition)
10th Edition
ISBN:9780134753119
Author:Sheldon Ross
Publisher:Sheldon Ross
Chapter1: Combinatorial Analysis
Section: Chapter Questions
Problem 1.1P: a. How many different 7-place license plates are possible if the first 2 places are for letters and...
Related questions
Question

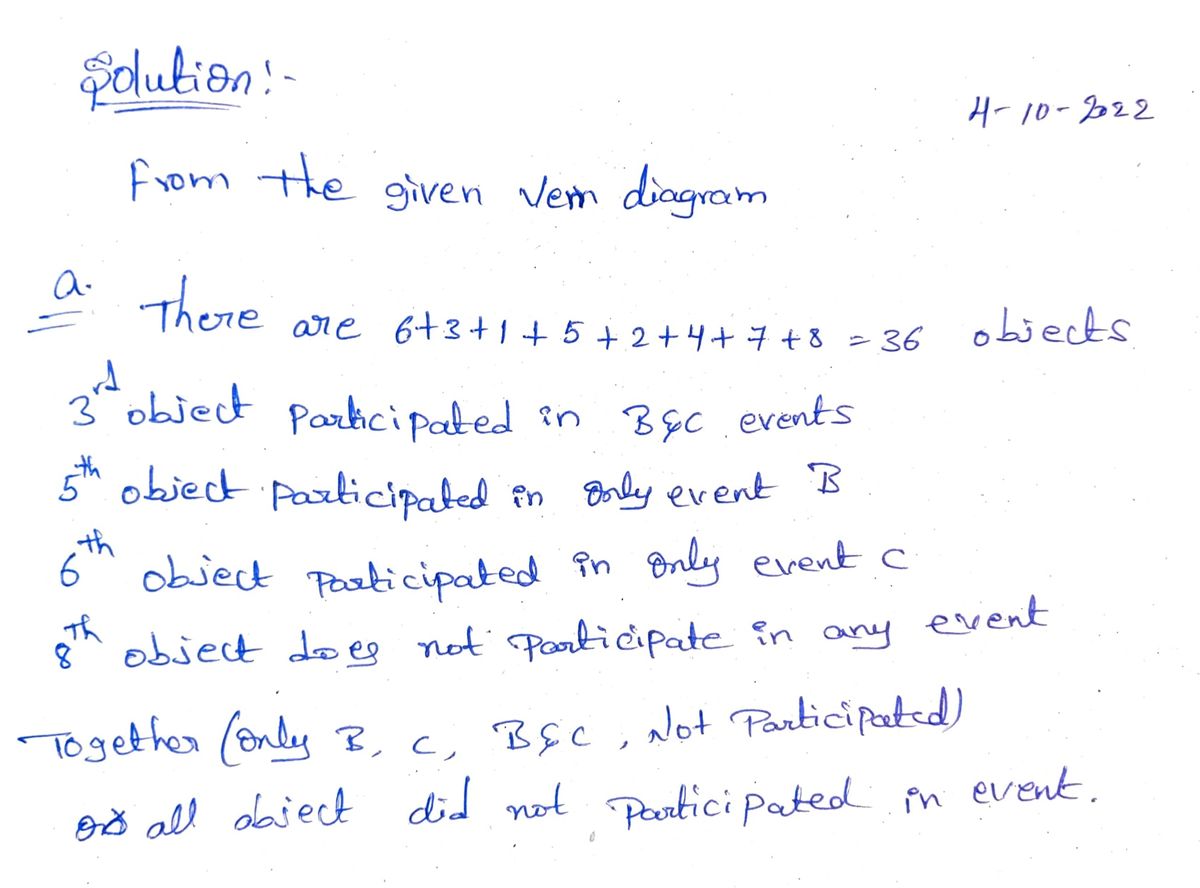
Transcribed Image Text:The image illustrates a Venn diagram consisting of three overlapping circles labeled A, B, and C. These circles are enclosed within a larger rectangular area, which has a shaded background. The regions in and around the circles are labeled with numbers from 1 to 8, representing different sections of the diagram:
1. The central region where all three circles overlap is labeled as "1".
2. The region where circles A and B overlap is labeled as "2".
3. The region where circles B and C overlap is labeled as "3".
4. The region where circles A and C overlap is labeled as "4".
5. The section within circle B, excluding any overlaps, is labeled as "5".
6. The section within circle C, excluding any overlaps, is labeled as "6".
7. The section within circle A, excluding any overlaps, is labeled as "7".
8. The shaded region outside all three circles is labeled as "8".
This diagram is used to visualize the relationships and intersections between the three sets A, B, and C.

Transcribed Image Text:**Problem #6: Set Operations Involving Events A, B, and C**
In the figure, A, B, and C are three events. Use set operations to express the following:
a) What event is represented by regions 3, 5, 6, and 8 together?
b) What event is represented by regions 2 and 5 together?
c) What event is represented by region 3 only?
*Note: The figure mentioned seems to be a Venn diagram illustrating the relationships between the sets A, B, and C and their intersections.*
Expert Solution
Step 1

Step by step
Solved in 2 steps with 2 images

Recommended textbooks for you

A First Course in Probability (10th Edition)
Probability
ISBN:
9780134753119
Author:
Sheldon Ross
Publisher:
PEARSON


A First Course in Probability (10th Edition)
Probability
ISBN:
9780134753119
Author:
Sheldon Ross
Publisher:
PEARSON
