3. Bealer invoice and list price for cars (thousands of dollars) List price X 32.1 33.4 47.8 36.1 44.5 Invoice price Y 29.8 31.1 42.2 32.0 42.3 a. Using Excel find the value of the correlation coefficient. Ans. b. Using Excel find the equation of the least squares line. Ans. C. Using Excel find the standard error of estimate Se . С. Ans. d. What is the predicted y value when x = 35 (thousand dollars)?


Correlation
Correlation defines a relationship between two independent variables. It tells the degree to which variables move in relation to each other. When two sets of data are related to each other, there is a correlation between them.
Linear Correlation
A correlation is used to determine the relationships between numerical and categorical variables. In other words, it is an indicator of how things are connected to one another. The correlation analysis is the study of how variables are related.
Regression Analysis
Regression analysis is a statistical method in which it estimates the relationship between a dependent variable and one or more independent variable. In simple terms dependent variable is called as outcome variable and independent variable is called as predictors. Regression analysis is one of the methods to find the trends in data. The independent variable used in Regression analysis is named Predictor variable. It offers data of an associated dependent variable regarding a particular outcome.


Hii ! Thanks for posting the question . Since your question has more than three subparts , we have solved first three subparts for you . If you need help with any other subpart then please repost the question by mentioning subpart name or index .
- Correlation Coefficient :
Correlation coefficients are used to measure how strong a relationship is between two variables. There are several types of correlation coefficient, but the most popular is Pearson’s. Pearson’s correlation (also called Pearson’s R) is a correlation coefficient commonly used in linear regression.
Correlation coefficient formulas are used to find how strong a relationship is between data. The formulas return a value between -1 and 1, where:
- 1 indicates a strong positive relationship.
- -1 indicates a strong negative relationship.
- A result of zero indicates no relationship at all.
(a)
The correlation coefficient (a value between -1 and +1) tells you how strongly two variables are related to each other. We can use the CORREL function or the Analysis Toolpak add-in in Excel to find the correlation coefficient between two variables.
Execute the following steps.
1. On the Data tab, in the Analysis group, click Data Analysis.
2. Select Correlation and click OK.
3. Select the data range as the Input Range.
4. Check Labels in first row.
5. Select any empty cell the Output Range.
6. Click OK.
Result.
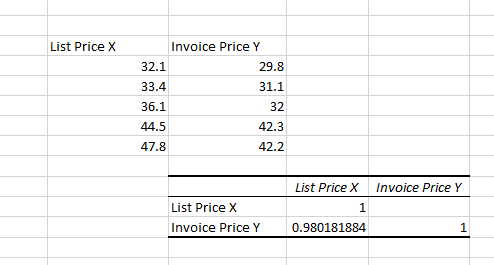
r = 0.98

Step by step
Solved in 4 steps with 3 images


