g. Does it appear that a line is the best way


Correlation
Correlation defines a relationship between two independent variables. It tells the degree to which variables move in relation to each other. When two sets of data are related to each other, there is a correlation between them.
Linear Correlation
A correlation is used to determine the relationships between numerical and categorical variables. In other words, it is an indicator of how things are connected to one another. The correlation analysis is the study of how variables are related.
Regression Analysis
Regression analysis is a statistical method in which it estimates the relationship between a dependent variable and one or more independent variable. In simple terms dependent variable is called as outcome variable and independent variable is called as predictors. Regression analysis is one of the methods to find the trends in data. The independent variable used in Regression analysis is named Predictor variable. It offers data of an associated dependent variable regarding a particular outcome.
size (inches)
9 11 20 27 32 35 40 48 53 60
sale price (s)
147 186 197 297 447 1177 1228 1463 1650 178
e.Find the
f. Find the estimated sale price for a 32 and 52 inch table.
g. Does it appear that a line is the best way to fit the data? Why or why not? h. What is the slope of the least-squares (best-fit) line? Interpret the slope.
Here the explanatory variable is x such that size and the predicted variable is y such that price.
The data given for size (inches) and sale price (s) is listed below
| x | y |
| 9 | 147 |
| 11 | 186 |
| 20 | 197 |
| 27 | 297 |
| 32 | 447 |
| 35 | 1177 |
| 40 | 1228 |
| 48 | 1463 |
| 53 | 1650 |
| 60 | 178 |
It is required to test whether correlation coefficient is significant.
First obtaining the least square and the correlation coefficient.
It can be solved using MS-Excel.
Steps for obtaining least square and the correlation coefficient the using MS-Excel are as follows
- Enter the data in MS-Excel
- Click on the Data toolbar >> Select the Data Analysis >> Regression
- Select the entire X column data as an input X range. (Check labels if included)
- Select the entire Y column data as an input Y range. (Check labels if included)
- Press ok
The output obtained is as follows
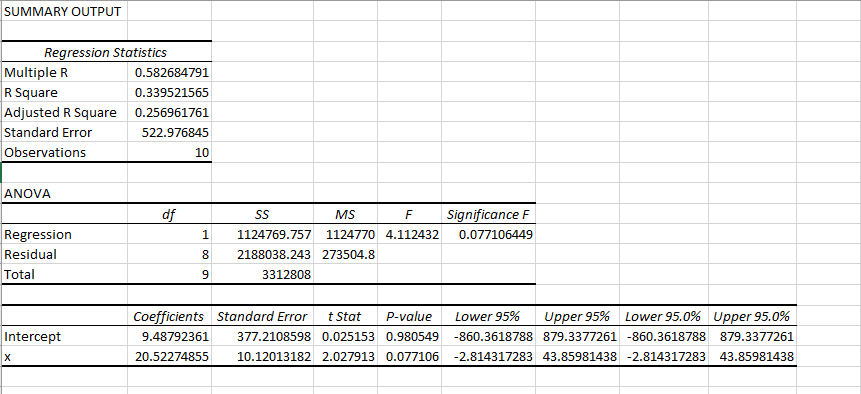
From the above output
The correlation coefficeint is r = 0.5827
As given,
The correlation coefficient (r) between the amounts of is
The sample size is n = 10
Now we want to test the significance of the correlation coefficient at 5% level of significance.
The most appropriate test is the significance of the correlation coefficient test.
Let be the population correlation coefficient between the variables ().
To test the significance the null hypothesis is given as
That is there no is a significant correlation between the variables.
Vs the alternative hypothesis is given as
That is there is a significant correlation between the variables.
Now obtaining the test statistic.
The test statistic is given as
=
The degree of freedom is given as
Df = n -2
= 8
Now obtaining the p-value.
Since the hypothesis is two-tailed the p-value for test statistic t = 2.027993 with df = 8 is given as
= 0.0771
Using the MS-EXCEL command (T.DIST.2T(2.027993,8 ))
Decision rule: -
At 5% level of significance
Reject the null hypothesis if p-value < 0.05
Accept otherwise.
Since p-value = 0.0771 > 0.05
We failed to reject the null hypothesis.
Conclusion: -
At 5% level of significance, there is no sufficient evidence to conclude that there is significant correlation between the variables.

Step by step
Solved in 4 steps with 1 images


