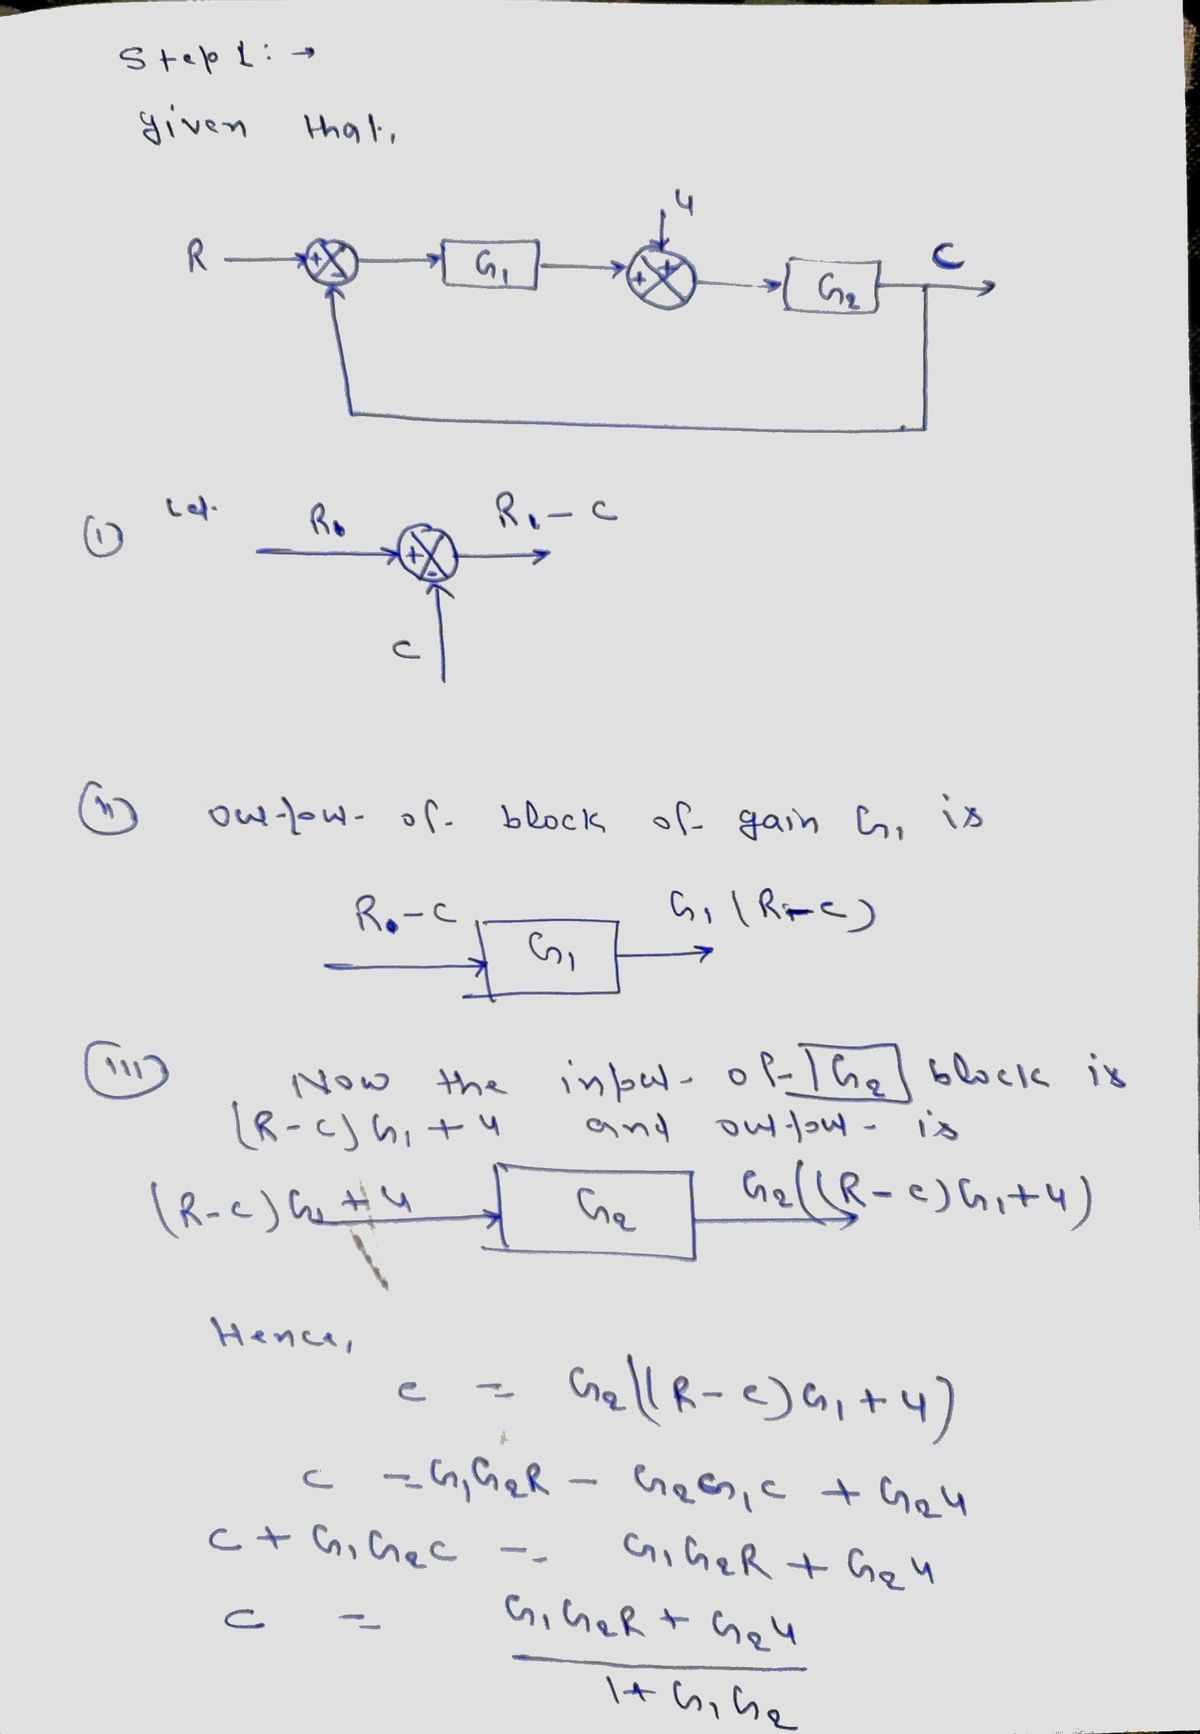
2. G2 determine the total c output formula if input: 0. Please answer by uploading detailed input steps with block diagrams(step by step)
Q: How does the number of attributes of a variable impact the number of cells in the cross-tabulation…
A: A cross-tabulation is a two- (or more) dimensional table that records the number (frequency) of…
Q: The 95% confidence interval for uz000 - P2001 is (-1,0, 1.7). (Round to one decimal place as…
A: We have been provided with 95% Confidence Interval :
Q: Mhbox (1,806)-24 taylor.upsh x | Page Not Found Clever | Portal Functions: Mastery Test Selec…
A: Given: h(x)=−4x2+11We can determine its end behaviour using its degree and leading coefficient.For…
Q: One-North Warehousing Services block stacks its SKUs in 50 rows. Each row is 3 deep and stack 3…
A: The number of items in a stack can be calculated by multiplying the number of rows by the number of…
Q: The fuel economy of a car (miles per gallon) varies with its speed. In an experiment, the following…
A:
Q: how to organize information pictorially using charts or graphs?
A: The three common charts representing statistical data are bar graphs, histograms and pie charts.…
Q: Fast 0 5 Fine 40 25 Handicap Under 15 15 or more Too Fast 1 39 ond
A: . a) The cross tabulation of condition of the greens by gender is below: The female golfers have…
Q: (a) To construct a serial correlation, we use data pairs (x, y) where x = original data and y =…
A: (a) Let x is defined as the original data, and y is defined as original data shifted ahead by one…
Q: Q40. A researcher wants to determine the factors that affect the number of sacks of rice a farmer…
A: In regression analysis, the number of dummy variables is equal to the number of categories minus 1.
Q: A furniture manufacturing company makes dining room tables and chairs. The relevant manufacturing…
A: Let x number of table and y number of chairs are made, then given LPP will be Max Z=90x+25ys.t.…
Q: Q4. Write a MATLAB code to plot the following x, y, and z in four different 3D plot types (bar…
A: For the given question answer is In matlab to plot 3d chart following methods are used bar3() to…
Q: A high school student kept track of the calorie content of all the snacks he ate for one week. He…
A: Given data indicates the calorie content of the snacks the student ate for one week. Sweet snacks -…
Q: isorder making it the most common illness in the US. At the end of the term 800 first year…
A: By applying the Chi-Square Independence, The Null and Alternative Hypotheses Ho : The two variables…
Q: d) Explain the meaning of the coefficient of gender (how does gender affect salary?). Does this…
A: Given : The coefficient of Gender = 1.95 The value is positive which denotes that there is a direct…
Q: An engineer wants to determine how the weight of a gas powered car, x, affects gas mileage, y. The…
A: The general form of the linear regression equation is, y⏞=bx+a Where, 'y⏞' is the predicted value of…
Q: A swimming pool is drained at the end of the summer. The following table shows the amount of water…
A: aFrom the given data:The amount of water was remaining after 0 hours=12000 gallons.This represents…
Q: d. Predict the waiting time when there are 18 customers in the store.
A: Given that Y-intercept, b0 = -0.5514 And slope, b1 = 0.1441 Also, Y denotes waiting time and X…
Q: what is the correct answer?
A: (B) In both tournaments, at least half the golfers completed the tournament with a score less than…
Q: HOW DOES SPRUCE, PINE, AND FIR PRODUCTION VARY MONTHLY IN CANADA? Geography North American Product…
A: Given information: NAPCS Production January 3772.4 February 3727.3 March 4279.2 April…
Q: Find the optimal mix of the product
A: Let x be the number of units of product 1 to be produced and y be the number of units of product 2…
Q: . How many extra coconut trees should you plant?
A: No of extra coconut trees
Q: (a) Construct a scatterplot of the weight (y) versus the height (x). Pass the ball: The NFL Scouting…
A: Given data: Height Weight 76 225 77 226 77 237 74 227 75 219 74 218 76 237 75…
Q: The data set below represents the number of calories in six different types of pizza. 230, 290, 280,…
A:
Q: The accompanying table shows the ages (in years) of 11 children and the numbers of words in their…
A:
Q: Exercise 1.6. Give two situations where "zero" and "nothing" mean the same thing, and two situations…
A: Given words:"Zero" and "Nothing"To explain the terms:a) through two situations with same meaning.b)…
Q: The electric power consumed each month by a chemical plant is thought to be related to the average…
A: Formula Used: Multiple linear regression: Y = b0 + b1X1 + b2X2 + b3X3 + b4X4 Where, Y is dependent…
Q: L3Q2.Describe the variables in the given table using a TI calculator. x y 15 12 20 22 17 -3…
A: Here we use the correlation coefficient concept to solve this problem. r = SSxy / sqrt ( SSxx ×…
Q: The data below shows the number of accidents in (200) Cities Vehicles Accidents Number of Cities…
A: Given data is appropriate for measures of central tendency to find a mean.
Q: Which phase in a forensic investigation is likely to be most relevant to Excel? Data analysis Data…
A: Which phase in a forensic investigation is likely to be most relevant to Excel?Data analysisData…
Q: The price (in R) and quantity of a basket of three items for the years 2019 and 2021 are given in…
A: The Laspeyres Price Index is a method of measuring the average change in prices over time. It is…
Q: Background information: Allison collected additional days of data to monitor the process. Steps to…
A: The following formulas are required for the Xbar chart and R chart.Xbar chart:…
Q: Make a visualization using excel and interpret (show the step by step process in excel)
A: The data has five categories which are compared over two time periods- 1910 and 2003. The best…
Q: You want to determine the effect of soap on bacterial colonies. In order to make sure that the…
A: Hypotheses for the test are given below: The appropriate test is two-sample t-test.
Q: (a) Find the number of these patients that had either high blood pressure or high cholesterol…
A: A survey was conducted among 68 patients admitted to a hospital cardiac unit during a two-week…
Q: The data set Pain contains hypothetical data for a clinical trial of a drug therapy to control pain.…
A: 0Yes60No261Yes71No262Yes92No233Yes143No184Yes234No9
Q: A company uses 3 machines X,Y and Z for their production. The company repairs each machine every…
A: Laspeyre's price index formula: P01L=∑p1q0∑p0q0×100 Where, p0= price of commodity in the base yr p1…
Step by step
Solved in 2 steps with 2 images
- Give an example of a refinement in mathematical modeling with contextual explanation.Plz asapAn engineer wants to determine how the weight of a gas powered car, x, affects gas mileage, y. The accompanying days represent the weights of various domestic cars and their miles per gallon in the city for the most recent model year. weight Miles per (pounds), x Gallon, y 3797 16 3897 16 2704 24 3608 20 3360 22 3040 22 3787 17 2618 24 3509 18 3798 16 3399 17 interpret the slope y-intercept, if appropriate. Choose the correct answer below for y hat = -0.00661x + 41.80 a) A weightless car will get ____ miles per gallon, on average. It is not appropriate to interpret the slope. b) for every pound added to the weight of the car, mileage in the city will…
- Once a computer worm infects a personal computer via an infected e-mail message, it sends a copy to 25-e-mail addresses it finds in the electronic message mailbox on this personal computer. What is the maximum number of different infected computers in the time it takes for the infected message to be forwarded six times? Note: You should count the total of infected computers including the initial one.The mtcars data set contains data on 32 cars from the 1974 Motor Trend US magazine. The data set has 11 variables that measure different aspects of the cars, such as miles per gallon (mpg), horsepower (hp), weight (wt), and number of cylinders (cyl). The data set can be used to study the relationship between fuel consumption and car performance, as well as other factors that affect the efficiency and design of the cars. What is the maximum and minimum number of the range regarding the explanatory variable for which the regression model can make valid predictions?For numbers 24-26: Aquascaping involves growing aquatic plants and aesthetically arranging them in an aquarium like a natural landscape. Success of growing plants depends on several factors such as light condition, water pH, and carbon dioxide level. It is of interest to determine if varying concentrations of carbon dioxide (0.5 ppm, 1.2 ppm, 1.5 ppm) introduced to an aquarium will promote or deter an aquatic plants' growth. Ten aquariums with one-week old plant were set-up and randomly assigned to each treatment. Below are the R outputs with 5% level of significance. data: 0.5 Wilk-Shapiro Test for Normality data: 1.2 p-value = 0.324 p-value = 0.2534 data: 1.5 p-value = 0.6369 Bartlett test of homogeneity of variances height by carbon dioxide data: Bartlett's K-squared 4.5623, df = 2, p-value = 0.1022 Analysis of Variance Df Sum Sq Mean Sq F value Pr (>F) carbon dioxide 2 88.73 44.37 6.131 0.0289 * Residuals 7 50.65 7.24 . Signif. codes: 0 ***** 0.001 **** 0.01 0.05 ¹.¹ 0.1 ¹ ¹ 1…
- The data indicate the number of wins and the number of goals scored for teams in the National Hockey League after the first month of the season. No. of wins, x B 5 6 9 10 0.885 Part: 0/3 9 Part 1 of 3 5 3 No. of goals, y 10 16 20 23 28 21 11 12 No. of wins, x 11 7 13 5 7 No. of goals, y 20 11 10 20 29 12 17 (a) Find the equation of regression line and draw the line on the scatter plot, but only if r is significant. Round the slope and y-intercept to four decimal places, if necessary. r (Choose one) significant at the 5% level. XAn agricultural experimenter divided a tract of land into seven plots of equal size. Each plot was treated with different levels of fertilizer to determine whether the level of fertilizer application affects yield. The results are shown below: Plot F 5.5 Level of Fertilizer, X Yleld (in Ibs), Y 3.0 3.5 4.0 4.5 5.0 6.0 53 57 56 58 62 59 63 What is the simple power equation for the given pairs of data? OY = 1.6266X^0.0216 OY = 0.2109X^0.0216 OY = 1.6266X^0.2155 %3D OY- 0.2109X^0.2155 O none of the abovePlease take a screenshot of all the steps ******************************** Q 1 (a) Enter the following data into PSPP : STUDENT NAME DEPARTMENT COURSE MARKS Tommy 1 Computer Networks 75 John 2 Software Engineering 87 Anabell 1 Programming 94 Rose 2 Information Technology 50 Sarah 2 Software Engineering 72 Value=1 represents “CS” Value=2 represents “IT” Perform the following on the above data: Using the Descriptive analysis calculate the Sum, Mean, Mode and Standard deviation for Marks Do a Frequency analysis on the variable “Department” and create a Pie chart for
- A researcher believed that the number of rental cars in service by a car rental company would have an impact on the total annual revenue for that car rental company. Five small car rental companies were surveyed, with the number of Cars in service recorded in units of 1000 (so if a car rental company had 54000 cars in service, a 54 would be recorded) and Annual Revenue measured in millions of dollars (so an Annual Revenue of $10,000,000 would be recorded as 10). The data follows: Cars (1,000s) Annual Revenue ($ millions)11.5 118 10.0 135 9.0 100 5.5 37 3.3 32 Part of the Excel-generated Simple Linear Regression output is provided below: ANOVA df SS MS F Significance F Regression 1 7891.863897 7891.863897 22.91180151 0.017339231 Residual 3 1033.336103 344.4453677 Total 4 8925.2 Coefficients Standard Error t Stat P-value Intercept -19.12490108 23.1658578…Complete the table.In Exercise 44, find all possible values of rank(A) asa varies. Please show all work