1. Pierret Problem 5.3 (a)-(c). Consider the pl-p2 isotype step junction shown below: (a) Draw the equilibrium energy band diagram for the junction, taking the doping to be nondegenerate and NAI>NA2. (b) Derive an expression for the built-in voltage Vbi that exists across the junction under equilibrium conditions. (c) Make rough sketches of the potential, electric field and charge density inside the junction. NA2 NA(X) NAI 10
1. Pierret Problem 5.3 (a)-(c). Consider the pl-p2 isotype step junction shown below: (a) Draw the equilibrium energy band diagram for the junction, taking the doping to be nondegenerate and NAI>NA2. (b) Derive an expression for the built-in voltage Vbi that exists across the junction under equilibrium conditions. (c) Make rough sketches of the potential, electric field and charge density inside the junction. NA2 NA(X) NAI 10

Related questions
Question

Transcribed Image Text:1. Pierret Problem 5.3 (a)-(c).
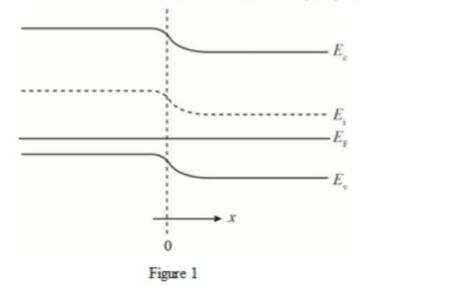
Consider the pl-p2 isotype step junction shown below:
(a) Draw the equilibrium energy band diagram for the junction, taking the doping to be
nondegenerate and NAI>NA2.
(b) Derive an expression for the built-in voltage Vbi that exists across the junction under
equilibrium conditions.
(c) Make rough sketches of the potential, electric field and charge density inside the
junction.
NA2
Calculate
(a) Built-in potential Vbi.
(b) Peak electric field at zero bias.
NA(X)
NAI
10
2. Quantitative analysis of PN junction electrostatics: A silicon pn junction at T=300K has
the doping profile shown in figure below.
N₁-N₂) (cm ³)
+5 × 10¹5
x=0
-1014
(c) Depletion region width x₂ and xp at 10V reverse bias.
(d) The applied bias required so that x₁ is 10µm.
Expert Solution
Step 1
a)
Proceed as follows in order to sketch the equilibrium energy band diagram for the
p1-p2 "isotype" step junction
As NA1 >NA2 and
p=ni exp [(Ei - Ey)/(kT)] = NA far from the junction, it follows that
(Ei - Ey}) v 0 >(Ei -Ey ) v 0

Trending now
This is a popular solution!

Step by step
Solved in 4 steps with 2 images
