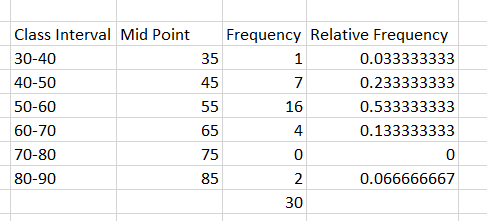
1. Make a questionnaire with one question (using Google form) for a sample size of 30 students to collect data on their weights (kg). Take screenshot for the survey then answer the following: a. Is the obtained data qualitative data or quantitative? b. Construct a frequency distribution table of 4 classes for the collecting data and find the relative frequency. c. Find the mean and median for the grouped data from (part b).


Unitary Method
The word “unitary” comes from the word “unit”, which means a single and complete entity. In this method, we find the value of a unit product from the given number of products, and then we solve for the other number of products.
Speed, Time, and Distance
Imagine you and 3 of your friends are planning to go to the playground at 6 in the evening. Your house is one mile away from the playground and one of your friends named Jim must start at 5 pm to reach the playground by walk. The other two friends are 3 miles away.
Profit and Loss
The amount earned or lost on the sale of one or more items is referred to as the profit or loss on that item.
Units and Measurements
Measurements and comparisons are the foundation of science and engineering. We, therefore, need rules that tell us how things are measured and compared. For these measurements and comparisons, we perform certain experiments, and we will need the experiments to set up the devices.
T2- Please solve this question in urgent basis. Many Thanks


We are supposed to answer 3 subparts at a time. Since you have not mentioned which subpart to answer, I am answering the first three subparts. Please repost the remaining subparts that you would like to be answered.
1. The data is quantitative as numerical values are involved.
2. Frequency table is as follows:

Step by step
Solved in 2 steps with 3 images


