1) Plot the graph of 2) Plot graph of graph of reciprocal a acceleration (y-aris) against unbalanced force (x-axis) acceleration against mass Plot a of mass (11m)
1) Plot the graph of 2) Plot graph of graph of reciprocal a acceleration (y-aris) against unbalanced force (x-axis) acceleration against mass Plot a of mass (11m)

Related questions
Question
100%
need help plotting these 3 graphs , thank you! :)

Transcribed Image Text:Unbalanced Force
F(N)
2 Plot
O
Plot
2-0
4.0
6.0
8-0
a
Acceleration
a (cm/s²)
a
O
7.8
Plot the graph of
graph
of
graph of reciprocal
15-7
23.0
58-8
Mass
(m)
1.0
2-0
3-0
4.0
Acceleration
a(cm/s²)
17.1
12.1
8.7
4-6
1
mars
(11m)
1.0
0.50
0-33
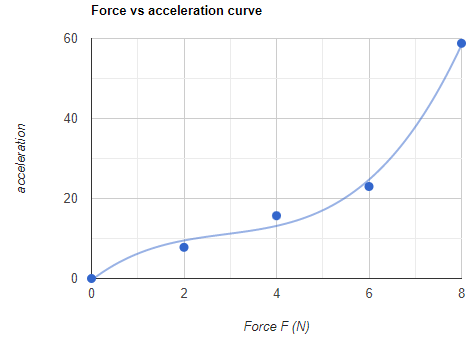
acceleration (y-axis) against unbalanced force (x-axis)
acceleration against mass
of mass
0-25
Expert Solution
Step 1
Solution:
1). The graph of acceleration against unbalanced force is plotted here,

Step by step
Solved in 3 steps with 3 images
