Dairy sales Peninsula Creameries sells both cottage cheese and ice cream. The CEO recently noticed that in months when the company sells more cottage cheese, it seems to sell more ice cream as well. Two of his aides were assigned to test whether this is true or not. The first aide’s plot and analysis of sales data for the past 12 months (in millions of pounds for cottage cheese and for ice cream) appear below. Dependent variable is Ice cream R-squared = 36.9% s = 8.320 with 12 - 2 = 10 degrees of freedom The other aide looked at the differences in sales of ice cream and cottage cheese for each month and created the following output: Cottage Cheese Ice Cream Count 12 Mean 11.8000 Median 15.3500 StdDev 7.99386 IntQRange 14.3000 25th %tile 3.20000 75th %tile 17.5000 Test H 0 : μ (CC - IC) = 0 vs H a : μ (CC – IC) ≠ 0 Sample Mean = 11.800000 t-Statistic = 5.113 w>11 df Prob = 0.0003 Lower 95% bound = 6.7209429 Upper 95% bound = 16.879057 a) Which analysis would you use to answer the CEO’s question? Why? b) What would you tell the CEO? c) Which analysis would you use to test whether the company sells more cottage cheese or ice cream in a typical year? Why? d) What would you tell the CEO about this other result? e) What assumptions are you making in the analysis you chose in part a? What assumptions are you making in the analysis in part c? f) Next month’s cottage cheese sales are 82 million pounds. Ice cream sales are not yet available. How much ice cream do you predict Peninsula Creameries will sell? g) Give a 95% confidence interval for the true slope of the regression equation of ice cream sales by cottage cheese sales. h) Explain what your interval means.
Dairy sales Peninsula Creameries sells both cottage cheese and ice cream. The CEO recently noticed that in months when the company sells more cottage cheese, it seems to sell more ice cream as well. Two of his aides were assigned to test whether this is true or not. The first aide’s plot and analysis of sales data for the past 12 months (in millions of pounds for cottage cheese and for ice cream) appear below. Dependent variable is Ice cream R-squared = 36.9% s = 8.320 with 12 - 2 = 10 degrees of freedom The other aide looked at the differences in sales of ice cream and cottage cheese for each month and created the following output: Cottage Cheese Ice Cream Count 12 Mean 11.8000 Median 15.3500 StdDev 7.99386 IntQRange 14.3000 25th %tile 3.20000 75th %tile 17.5000 Test H 0 : μ (CC - IC) = 0 vs H a : μ (CC – IC) ≠ 0 Sample Mean = 11.800000 t-Statistic = 5.113 w>11 df Prob = 0.0003 Lower 95% bound = 6.7209429 Upper 95% bound = 16.879057 a) Which analysis would you use to answer the CEO’s question? Why? b) What would you tell the CEO? c) Which analysis would you use to test whether the company sells more cottage cheese or ice cream in a typical year? Why? d) What would you tell the CEO about this other result? e) What assumptions are you making in the analysis you chose in part a? What assumptions are you making in the analysis in part c? f) Next month’s cottage cheese sales are 82 million pounds. Ice cream sales are not yet available. How much ice cream do you predict Peninsula Creameries will sell? g) Give a 95% confidence interval for the true slope of the regression equation of ice cream sales by cottage cheese sales. h) Explain what your interval means.
Solution Summary: The author explains the appropriate analysis for the CEO's question. The scatter plot, regression analysis output, histogram of difference, and descriptive statistics are given.
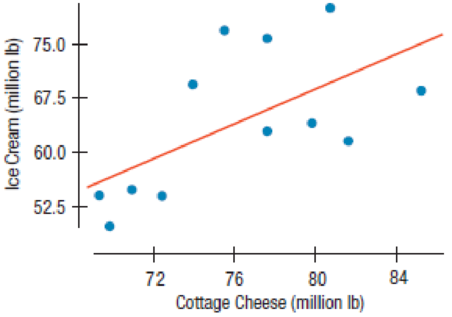
Dairy sales Peninsula Creameries sells both cottage cheese and ice cream. The CEO recently noticed that in months when the company sells more cottage cheese, it seems to sell more ice cream as well. Two of his aides were assigned to test whether this is true or not. The first aide’s plot and analysis of sales data for the past 12 months (in millions of pounds for cottage cheese and for ice cream) appear below.
Dependent variable is Ice cream
R-squared = 36.9%
s = 8.320 with 12 - 2 = 10 degrees of freedom
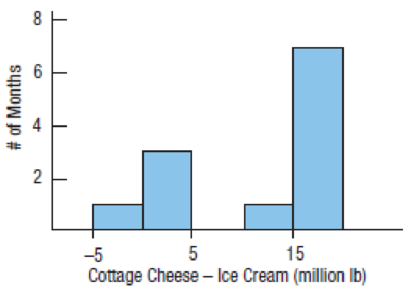
The other aide looked at the differences in sales of ice cream and cottage cheese for each month and created the following output:
Cottage Cheese
Ice Cream
Count
12
Mean
11.8000
Median
15.3500
StdDev
7.99386
IntQRange
14.3000
25th %tile
3.20000
75th %tile
17.5000
Test H0: μ(CC - IC) = 0 vs Ha: μ(CC – IC) ≠ 0
Sample Mean = 11.800000 t-Statistic = 5.113 w>11 df
Prob = 0.0003
Lower 95% bound = 6.7209429
Upper 95% bound = 16.879057
a) Which analysis would you use to answer the CEO’s question? Why?
b) What would you tell the CEO?
c) Which analysis would you use to test whether the company sells more cottage cheese or ice cream in a typical year? Why?
d) What would you tell the CEO about this other result?
e) What assumptions are you making in the analysis you chose in part a? What assumptions are you making in the analysis in part c?
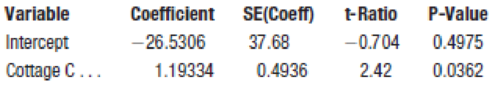
f) Next month’s cottage cheese sales are 82 million pounds. Ice cream sales are not yet available. How much ice cream do you predict Peninsula Creameries will sell?
g) Give a 95% confidence interval for the true slope of the regression equation of ice cream sales by cottage cheese sales.
h) Explain what your interval means.
Statistics that help describe, summarize, and present information extracted from data. Descriptive statistics include concepts related to measures of central tendency, measures of variability, measures of frequency, shape of distribution, and some data visualization techniques/tools such as pivot tables, charts, and graphs.
NC Current Students - North Ce X | NC Canvas Login Links - North ( X
Final Exam Comprehensive x Cengage Learning
x
WASTAT - Final Exam - STAT
→
C
webassign.net/web/Student/Assignment-Responses/submit?dep=36055360&tags=autosave#question3659890_9
Part (b)
Draw a scatter plot of the ordered pairs.
N
Life
Expectancy
Life
Expectancy
80
70
600
50
40
30
20
10
Year of
1950
1970 1990
2010 Birth
O
Life
Expectancy
Part (c)
800
70
60
50
40
30
20
10
1950
1970 1990
W
ALT
林
$
#
4
R
J7
Year of
2010 Birth
F6
4+
80
70
60
50
40
30
20
10
Year of
1950 1970 1990
2010 Birth
Life
Expectancy
Ox
800
70
60
50
40
30
20
10
Year of
1950 1970 1990 2010 Birth
hp
P.B.
KA
&
7
80
% 5
H
A
B
F10
711
N
M
K
744
PRT SC
ALT
CTRL
Harvard University
California Institute of Technology
Massachusetts Institute of Technology
Stanford University
Princeton University
University of Cambridge
University of Oxford
University of California, Berkeley
Imperial College London
Yale University
University of California, Los Angeles
University of Chicago
Johns Hopkins University
Cornell University
ETH Zurich
University of Michigan
University of Toronto
Columbia University
University of Pennsylvania
Carnegie Mellon University
University of Hong Kong
University College London
University of Washington
Duke University
Northwestern University
University of Tokyo
Georgia Institute of Technology
Pohang University of Science and Technology
University of California, Santa Barbara
University of British Columbia
University of North Carolina at Chapel Hill
University of California, San Diego
University of Illinois at Urbana-Champaign
National University of Singapore
McGill…
Name
Harvard University
California Institute of Technology
Massachusetts Institute of Technology
Stanford University
Princeton University
University of Cambridge
University of Oxford
University of California, Berkeley
Imperial College London
Yale University
University of California, Los Angeles
University of Chicago
Johns Hopkins University
Cornell University
ETH Zurich
University of Michigan
University of Toronto
Columbia University
University of Pennsylvania
Carnegie Mellon University
University of Hong Kong
University College London
University of Washington
Duke University
Northwestern University
University of Tokyo
Georgia Institute of Technology
Pohang University of Science and Technology
University of California, Santa Barbara
University of British Columbia
University of North Carolina at Chapel Hill
University of California, San Diego
University of Illinois at Urbana-Champaign
National University of Singapore…
Need a deep-dive on the concept behind this application? Look no further. Learn more about this topic, statistics and related others by exploring similar questions and additional content below.
Correlation Vs Regression: Difference Between them with definition & Comparison Chart; Author: Key Differences;https://www.youtube.com/watch?v=Ou2QGSJVd0U;License: Standard YouTube License, CC-BY
Correlation and Regression: Concepts with Illustrative examples; Author: LEARN & APPLY : Lean and Six Sigma;https://www.youtube.com/watch?v=xTpHD5WLuoA;License: Standard YouTube License, CC-BY


 Glencoe Algebra 1, Student Edition, 9780079039897...AlgebraISBN:9780079039897Author:CarterPublisher:McGraw Hill
 Big Ideas Math A Bridge To Success Algebra 1: Stu...AlgebraISBN:9781680331141Author:HOUGHTON MIFFLIN HARCOURTPublisher:Houghton Mifflin Harcourt
 Holt Mcdougal Larson Pre-algebra: Student Edition...AlgebraISBN:9780547587776Author:HOLT MCDOUGALPublisher:HOLT MCDOUGAL
 Functions and Change: A Modeling Approach to Coll...AlgebraISBN:9781337111348Author:Bruce Crauder, Benny Evans, Alan NoellPublisher:Cengage Learning
 College AlgebraAlgebraISBN:9781305115545Author:James Stewart, Lothar Redlin, Saleem WatsonPublisher:Cengage Learning