
Concept explainers
Videos
(a)
To draw and carefully label the model.
(a)
Explanation of Solution
In the question, it is given based on long-term investigation, researchers have suggested that the acidity of rainfall in the Shenandoah mountains can be described by the Normal model
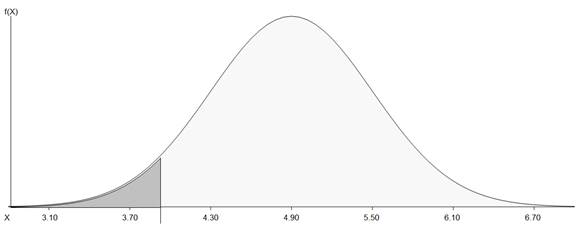
(b)
To find out what percent of storms produce rainfall with pH over
(b)
Answer to Problem 8RE
Explanation of Solution
In the question, it is given based on long-term investigation, researchers have suggested that the acidity of rainfall in the Shenandoah mountains can be described by the Normal model
Thus, the percent of storms produce rainfall with pH over
(c)
To find out what percent of storms produce rainfall with pH under
(c)
Answer to Problem 8RE
Explanation of Solution
In the question, it is given based on long-term investigation, researchers have suggested that the acidity of rainfall in the Shenandoah mountains can be described by the Normal model
Thus, the percent of storms produce rainfall with pH under
(d)
To find out what is the pH level for the most acidic
(d)
Answer to Problem 8RE
The
Explanation of Solution
In the question, it is given based on long-term investigation, researchers have suggested that the acidity of rainfall in the Shenandoah mountains can be described by the Normal model
Thus, the value will be calculated as:
Thus, the
(e)
To find out what is the pH level for the least acidic
(e)
Answer to Problem 8RE
The
Explanation of Solution
In the question, it is given based on long-term investigation, researchers have suggested that the acidity of rainfall in the Shenandoah mountains can be described by the Normal model
Thus, the value will be calculated as:
Thus, the
(f)
To find out what is the IQR for the pH of rainfall.
(f)
Answer to Problem 8RE
Explanation of Solution
In the question, it is given based on long-term investigation, researchers have suggested that the acidity of rainfall in the Shenandoah mountains can be described by the Normal model
Therefore the IQR will be as:
And also,
Thus, we have,
Chapter PI Solutions
Stats: Modeling the World Nasta Edition Grades 9-12
Additional Math Textbook Solutions
Elementary Statistics (13th Edition)
Thinking Mathematically (6th Edition)
Calculus: Early Transcendentals (2nd Edition)
Elementary Statistics
University Calculus: Early Transcendentals (4th Edition)
Precalculus


- help me with ab please. please handwrite if possible. please don't use AI tools to answerarrow_forwardhelp me with ab please. please handwrite if possible. please don't use AI tools to answerarrow_forwardhelp me with abcd please. please handwrite if possible. please don't use AI tools to answerarrow_forward
- help me with abc please. please handwrite if possible. please don't use AI tools to answerarrow_forwardhelp me with abc please. please handwrite if possible. please don't use AI tools to answerarrow_forwardhelp me with abc please. please handwrite if possible. please don't use AI tools to answer.arrow_forward
- Please help me with this statistics questionarrow_forwardPlease help me with the following statistic questionarrow_forwardTo evaluate the success of a 1-year experimental program designed to increase the mathematical achievement of underprivileged high school seniors, a random sample of participants in the program will be selected and their mathematics scores will be compared with the previous year’s statewide average of 525 for underprivileged seniors. The researchers want to determine whether the experimental program has increased the mean achievement level over the previous year’s statewide average. If alpha=.05, what sample size is needed to have a probability of Type II error of at most .025 if the actual mean is increased to 550? From previous results, sigma=80.arrow_forward
- Please help me answer the following questions from this problem.arrow_forwardPlease help me find the sample variance for this question.arrow_forwardCrumbs Cookies was interested in seeing if there was an association between cookie flavor and whether or not there was frosting. Given are the results of the last week's orders. Frosting No Frosting Total Sugar Cookie 50 Red Velvet 66 136 Chocolate Chip 58 Total 220 400 Which category has the greatest joint frequency? Chocolate chip cookies with frosting Sugar cookies with no frosting Chocolate chip cookies Cookies with frostingarrow_forward
 MATLAB: An Introduction with ApplicationsStatisticsISBN:9781119256830Author:Amos GilatPublisher:John Wiley & Sons Inc
 Probability and Statistics for Engineering and th...StatisticsISBN:9781305251809Author:Jay L. DevorePublisher:Cengage Learning
 Statistics for The Behavioral Sciences (MindTap C...StatisticsISBN:9781305504912Author:Frederick J Gravetter, Larry B. WallnauPublisher:Cengage Learning
 Elementary Statistics: Picturing the World (7th E...StatisticsISBN:9780134683416Author:Ron Larson, Betsy FarberPublisher:PEARSON
 The Basic Practice of StatisticsStatisticsISBN:9781319042578Author:David S. Moore, William I. Notz, Michael A. FlignerPublisher:W. H. Freeman
 Introduction to the Practice of StatisticsStatisticsISBN:9781319013387Author:David S. Moore, George P. McCabe, Bruce A. CraigPublisher:W. H. Freeman