Videos
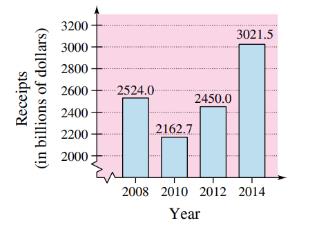
In Exercises 49-52, use the bar graph, which shows the receipts of the federal government (in billions of dollars) for selected years from

Want to see the full answer?
Check out a sample textbook solution
Chapter P Solutions
Bundle: College Algebra, Loose-leaf Version, 10th + WebAssign Printed Access Card for Larson's College Algebra, 10th Edition, Single-Term


- There were 426 books sold in one week. The number of biology books sold was 5 times that of the number of psychology books. How many books each were sold?arrow_forwardPopulation decreases 5% each year. Starts with a starting population of 3705. Find that population after 5 years.arrow_forwardsolve using substitution -2x-3y=-15 -3x+9y=12arrow_forward
- Suppose that 7000 is placed in an accout that pays 4% interest. Interest compunds each year. Assume that no withdraws are made. How much would the account have after 1 year? And how much would the account have after 2 years?arrow_forwardUse substitution to solve the equations -2x+5y=18 x=2y-8arrow_forward5) For each function represented by an equation, make a table and plot the corresponding points to sketch the graph of the function. (a) y = 75 ()* 220 X y 200- -2 180 160 -1 140 0 120 100 1 60 80 2 3 4 x (b) y = 20 ()* 1 60 40 20 20 0 2 3 65- -1 X y 60 -2 55- 50 45 44 40 0 35- 30 1 25 2 20 20 15 3 10 5 LO 4 3-2 T -1 0 5- 4- -3- 2-arrow_forward
- A system of inequalities is shown. y 5 3 2 1 X -5 -4 -3 -2 -1 0 1 2 3 4 5 -1- Which system is represented in the graph? Oy>-x²-x+1 y 2x²+3 -2 -3 тarrow_forwardWhich set of systems of equations represents the solution to the graph? -5 -4 -3 -2 Of(x) = x² + 2x + 1 g(x) = x²+1 f(x) = x²+2x+1 g(x) = x²-1 f(x) = −x² + 2x + 1 g(x) = x²+1 f(x) = x² + 2x + 1 g(x) = x²-1 -1 5 y 4 3 2 1 0 -1- -2 -3- -4. -5 1 2 3 4 5arrow_forwardWhich of the graphs below correctly solves for x in the equation -x² - 3x-1=-x-4? о 10 8 (0,2) -10 -8 -6 -2 2 4 6 8 10 (-4,-2) -2 + (0,2) (4,6) -10-8-6-4-2 -2 2 4 6 8 10 (-3, -1) -2 2 (1-5) -6 -8 -10 10 -10-8-6-4-2 2 6 8 10 (2,0)arrow_forward
- 1) Express these large and small numbers from the Read and Study section in scientific notation: (a) 239,000 miles (b) 3,800,000,000,000 sheets of paper (c) 0.0000000000000000000000167 grams 2) Find all values for the variable x that make these equations true. (a) 5x = 1 (b) 3x = 1/1 9 (c) 4* = 11/ 4 (e) 4* = 64 (g) 10x = 1,000,000 (d) 3x=-3 (f) 2x = = 8 (h) 10x = 0.001arrow_forward(b) 4) Find an equation to fit each of the following graphs: (a) 20 20 18 16 14 12 10 8 6 4 2 24 22 20 18 16 14 12 10 8 16 A 2 -3 -2 -1-0 2 3 4. -1 0 1 2 3. -2 -2arrow_forward3) Which of the following are equivalent to 3? (There may be more than one that is equivalent!) -1 (a) (9)¯¹ 3. (b) (-3)-1 (c) (-3) -1 (d) -(¯3) (e) 11 3-1 (f) 3-4arrow_forward
 Glencoe Algebra 1, Student Edition, 9780079039897...AlgebraISBN:9780079039897Author:CarterPublisher:McGraw Hill
 Holt Mcdougal Larson Pre-algebra: Student Edition...AlgebraISBN:9780547587776Author:HOLT MCDOUGALPublisher:HOLT MCDOUGAL
 Algebra: Structure And Method, Book 1AlgebraISBN:9780395977224Author:Richard G. Brown, Mary P. Dolciani, Robert H. Sorgenfrey, William L. ColePublisher:McDougal Littell
 Functions and Change: A Modeling Approach to Coll...AlgebraISBN:9781337111348Author:Bruce Crauder, Benny Evans, Alan NoellPublisher:Cengage Learning
 Elementary AlgebraAlgebraISBN:9780998625713Author:Lynn Marecek, MaryAnne Anthony-SmithPublisher:OpenStax - Rice University