In Exercises 49-52, use the bar graph, which shows the receipts of the federal government (in billions of dollars) for selected years from 2008 through 2014 . In each exercise, you are given the expenditures of the federal government. Find the magnitude of the surplus or deficit for the year. Year Receipts, R Expenditures , E ∣ R − E ∣ 2008 $2982 .5 billion
In Exercises 49-52, use the bar graph, which shows the receipts of the federal government (in billions of dollars) for selected years from 2008 through 2014 . In each exercise, you are given the expenditures of the federal government. Find the magnitude of the surplus or deficit for the year. Year Receipts, R Expenditures , E ∣ R − E ∣ 2008 $2982 .5 billion
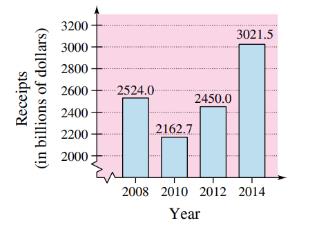
Solution Summary: The author calculates the value of left|R-Eright| for 2008 by using the given bar graph and E=2982.5
In Exercises 49-52, use the bar graph, which shows the receipts of the federal government (in billions of dollars) for selected years from
2008
through
2014
. In each exercise, you are given the expenditures of the federal government. Find the magnitude of the surplus or deficit for the year.
Year
Receipts,
R
Expenditures
,
E
∣
R
−
E
∣
2008
$2982
.5 billion
Solutions of inequalitie
Google Classroom
Mic
Is (-3, 2) a solution of 7x+9y > -3?
Choose 1 answer:
A
Yes
B
No
Related content
▶6:06
Testing solutions to inequalities
2 of 4
Are natural logarithms used in real life ? How ? Can u give me two or three ways we can use them. Thanks
Need a deep-dive on the concept behind this application? Look no further. Learn more about this topic, algebra and related others by exploring similar questions and additional content below.


 Glencoe Algebra 1, Student Edition, 9780079039897...AlgebraISBN:9780079039897Author:CarterPublisher:McGraw Hill
 Holt Mcdougal Larson Pre-algebra: Student Edition...AlgebraISBN:9780547587776Author:HOLT MCDOUGALPublisher:HOLT MCDOUGAL
 Algebra: Structure And Method, Book 1AlgebraISBN:9780395977224Author:Richard G. Brown, Mary P. Dolciani, Robert H. Sorgenfrey, William L. ColePublisher:McDougal Littell
 Functions and Change: A Modeling Approach to Coll...AlgebraISBN:9781337111348Author:Bruce Crauder, Benny Evans, Alan NoellPublisher:Cengage Learning
 Elementary AlgebraAlgebraISBN:9780998625713Author:Lynn Marecek, MaryAnne Anthony-SmithPublisher:OpenStax - Rice University