Financial Accounting
15th Edition
ISBN: 9781337272124
Author: Carl Warren, James M. Reeve, Jonathan Duchac
Publisher: Cengage Learning
expand_more
expand_more
format_list_bulleted
Textbook Question
Chapter MJ, Problem 1IFRS
IFRS Activity 1
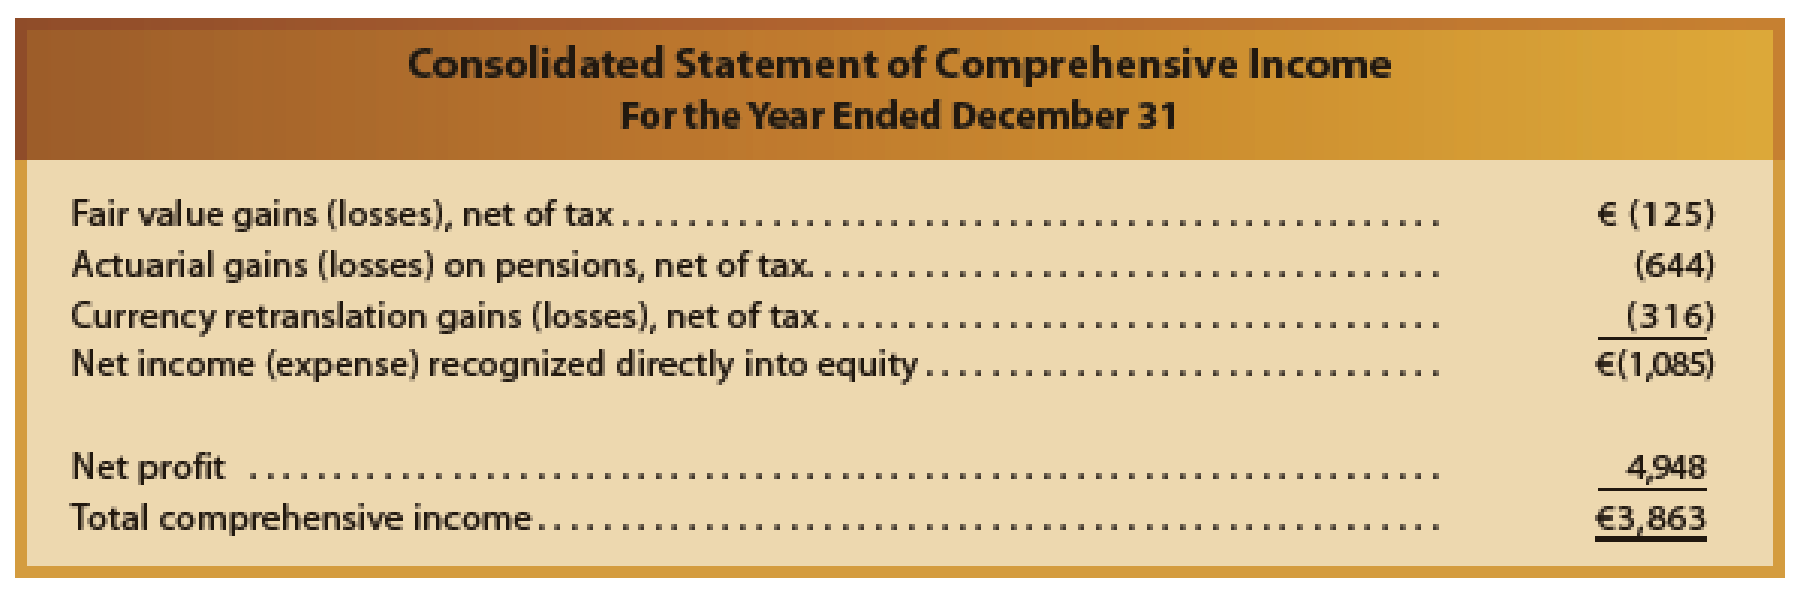
Unilever Group is a global company that markets a wide variety of products, including Lever® soap, Breyer’s® ice cream, and Hellman’s® mayonnaise. A recent income statement and statement of comprehensive income for the Dutch company, Unilever Group, follow:
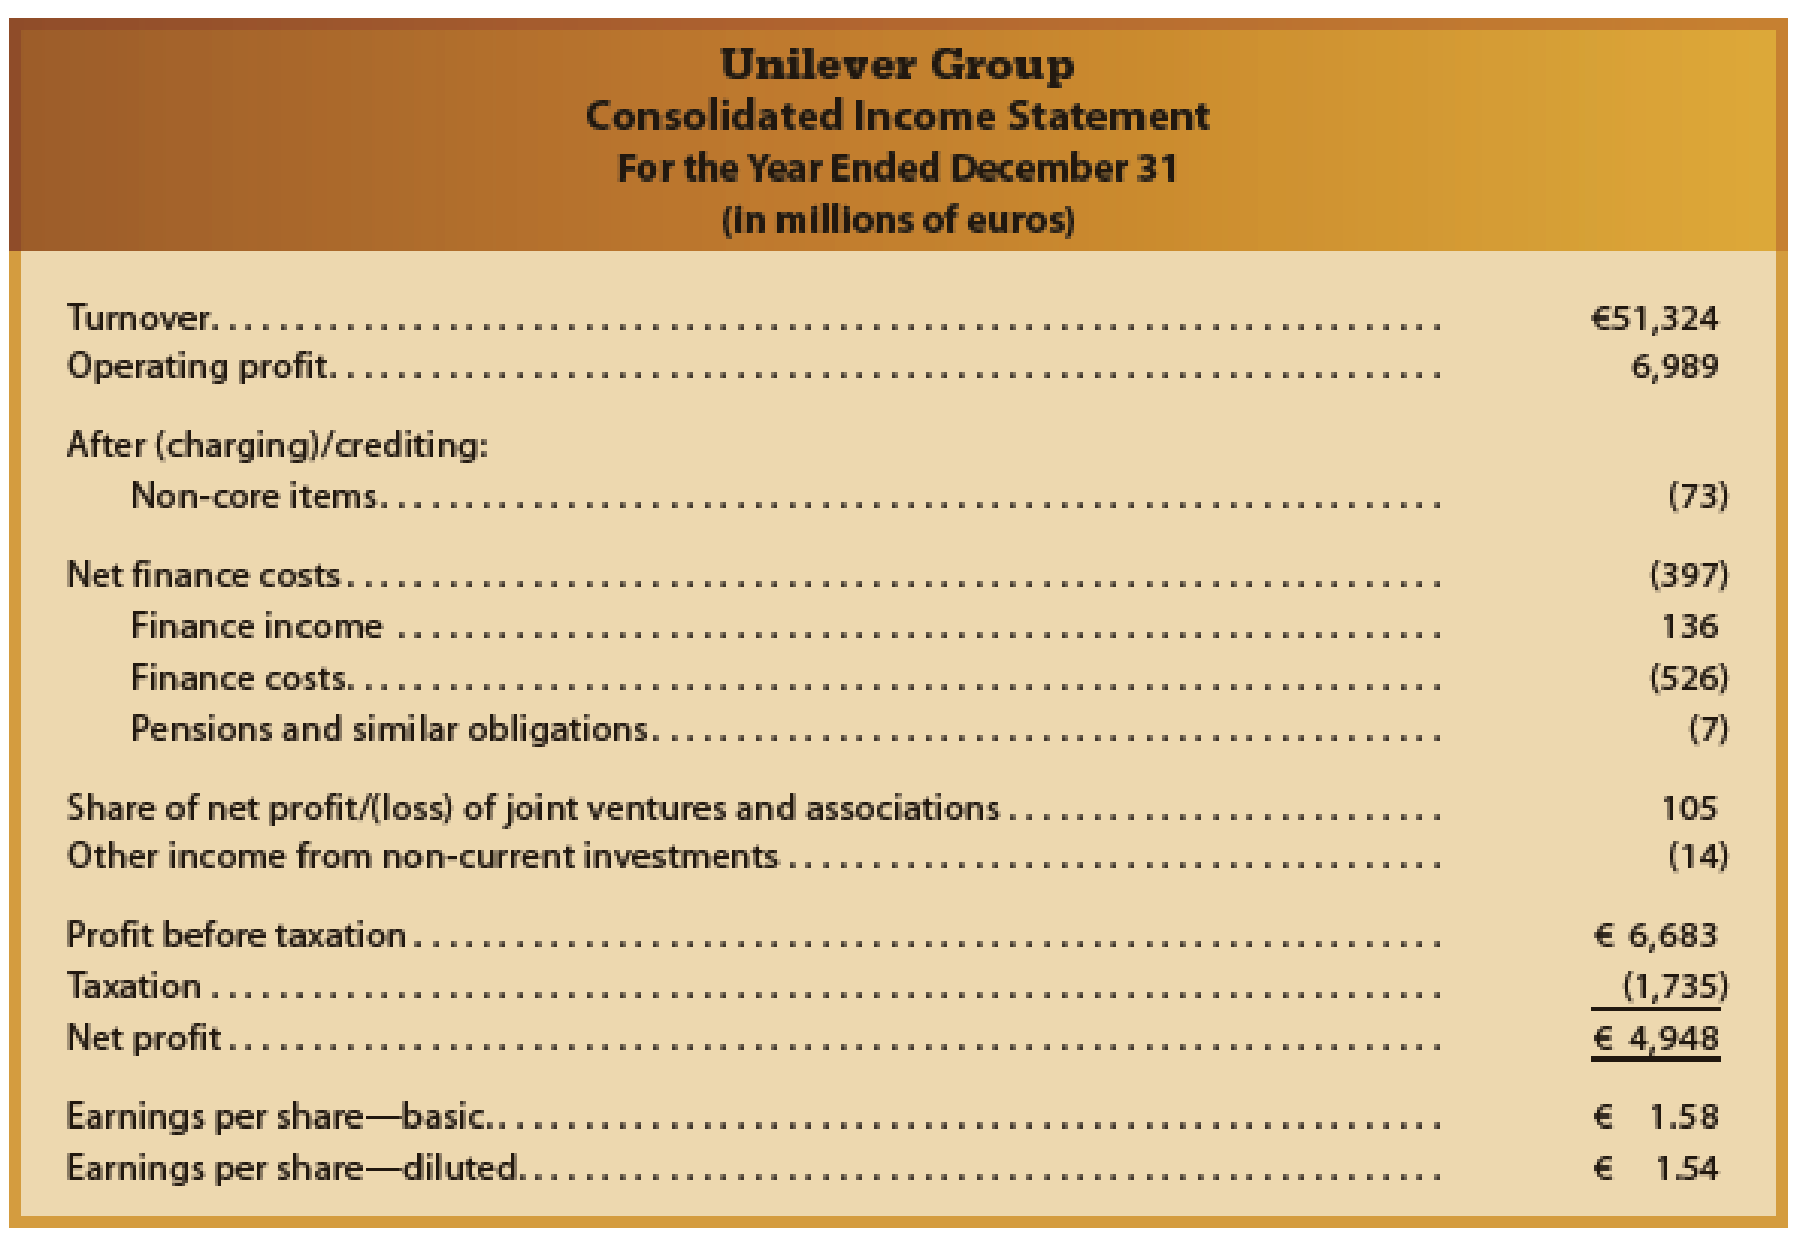
- a. What do you think is meant by “turnover”?
- b. How does Unilever’s income statement presentation differ significantly from that of Mornin’ Joe?
- c. How is the total for net finance costs presented differently from what typically would be found under U.S. GAAP?
Expert Solution & Answer
Want to see the full answer?
Check out a sample textbook solutionStudents have asked these similar questions
Activity Ratios
Provide brief definition of what Activity ratios mean to the profitability of a company.
What are the differences between Apple and Samsung in relationship to the ratios?
See attached for ratios
Total Asset Turnover
Inventory Turnover
Fixed Asset turnover
Receivable Turnover
3. What does it mean to the company’s profitability? Is it good or bad?
go.3
Preparing common-size income statement
Data for Connor Inc and Alto Corp follow:
Requirements
Prepare common-size income statements.
Which company earns more net income?
Which company’s net income is a higher percentage or its net sales revenue?
Chapter MJ Solutions
Financial Accounting
Ch. MJ - Prob. 1DQCh. MJ - What is the difference between classifying an...Ch. MJ - If a functional expense classification is used for...Ch. MJ - Prob. 4DQCh. MJ - What are two main differences in inventory...Ch. MJ - Prob. 6DQCh. MJ - Prob. 7DQCh. MJ - Prob. 8DQCh. MJ - Prob. 9DQCh. MJ - IFRS Activity 1
Unilever Group is a global company...
Knowledge Booster
Learn more about
Need a deep-dive on the concept behind this application? Look no further. Learn more about this topic, accounting and related others by exploring similar questions and additional content below.Similar questions
- ↓ #becausesneaker... HW CH 17 v2.cengagenow.com/ilrn/take... Custom Order Vertical Analysis Income statement information for Ivanoff Corporation follows: Sales Cost of goods sold Gross profit Sales Cost of goods sold Gross profit $428,000 154,080 273,920 Prepare a vertical analysis of the income statement for Ivanoff Corporation. If required, round percentage answers to the nearest whole number. Ivanoff Corporation Vertical Analysis of the Income Statement Amount Percentage $428,000 154,080 $273,920 % % 11 % +arrow_forwardBenchmark analysis: Trademark Corp.'s financial manager collected the following information for its peer group to compare its performance against that of its peers. Ratios Trademark Peer Group DSO 33.5 days 27.9 days Total assets turnover 2.3 3.7 Inventory turnover 1.8 2.8 Quick ratio 0.6 1.3 (a) Explain how Trademark is performing relative to its peers. (b) How do the industry ratios help Trademark's management?arrow_forwardPerforming vertical analysis The Randall Department Stores, Inc. chief executive officer (CEO) has asked you to compare the company’s profit performance and financial position with the averages for the industry. The CEO has given you the company’s income statement and sheet as well as the industry average data for retailers. Requirements Prepare a vertical analysis for Randall for both its income statement and balance sheet. 2 Compare the company’s profit performance and financial position with the average for the industry.arrow_forward
- practice please help with formulaarrow_forwardQuestions 16-23arrow_forwardExcel Online Structured Activity: Balance Sheet Analysis Consider the following financial data for J. White Industries: Total assets turnover: 1.2Gross profit margin on sales: (Sales - Cost of goods sold)/Sales = 27%Total liabilities-to-assets ratio: 45%Quick ratio: 0.90Days sales outstanding (based on 365-day year): 29.5 daysInventory turnover ratio: 4.0 The data has been collected in the Microsoft Excel Online file below. Open the spreadsheet and perform the required analysis to answer the questions below. Open spreadsheet Complete the balance sheet and sales information in the table that follows for J. White Industries. Do not round intermediate calculations. Round your answers to the nearest whole dollar. Partial Income StatementInformation Sales $ fill in the blank 2 Cost of goods sold $ fill in the blank 3 Balance Sheet Cash $ fill in the blank 4 Accounts payable $ fill in the blank 5 Accounts receivable $ fill in the blank 6 Long-term debt $…arrow_forward
- #becausesneaker.... HW CH 17 Vertical Analysis of Income Statement Revenue and expense data for Innovation Quarter Inc. for two recent years are as follows: Current Year Previous Year Sales Cost of merchandise sold Selling expenses Administrative expenses Income tax expense Custom Order Sales Cost of merchandise sold Selling expenses a. Prepare an income statement in comparative form, statin each item for both years as a percent of sales. If required, round percentages to one decimal place. Enter all amounts as positive numbers. Administrative expenses Income tax expense $483,000 280,140 82,110 86,940 14,490 Innovation Quarter Inc. Comparative Income Statement For the Years Ended December 31 Current year Amount $483,000 280,140 82,110 86,940 14,490 percentage points, and administrative expenses net income as a percent of sales Current year Percent % % % % % % $420,000 218,400 79,800 71,400 21,000 % % % Previous year Amount $420,000 218,400 79,800 71,400 21,000 Previous year Percent b.…arrow_forwardComparability and Consistency in Income Statements The following income statements were provided by Chisholm Company, a wholesale food distributor: Required Identify each income statement as either single- or multiple-step format. Restate each item in the income statements as a percentage of sales. Why did net income remain unchanged when sales increased in 2016?arrow_forwardAnswer the single step income statementarrow_forward
- QUESTION 4 a) Below are selected ratios for three companies which operate in three different industries: Discount Retail Store, Drug and Utility. Industry COGS/Sales A B 80% 58% n/a R&D/Sales 0% 7% 0.1% Advertising/Sales Interest/Sales Net Income/Sales Return on Assets Inventory Turnover Accounts receivable Not defined 3% 0.1% 0.9% 1% 6% 2.5% 10% 10% 8.5% 10.6% 7.2% 5.5 4 n/a 100 9 turnover Long term debt/equity n/a= not applicable 60% 50% 92% Identify which industry each of the companies A, B and C operate in. Give TWO (2) reasons for each of your selections.arrow_forwardFanning Company operates three segments. Income statements for the segments imply that profitability could be improved if Segment A were eliminated. Segment Sales Cost of goods sold Sales commissions Contribution margin General fixed operating expenses (allocation of president's salary) Advertising expense (specific to individual divisions) Net income (loss) FANNING COMPANY Income Statements for Year 2 Complete this question by entering your answers in the tabs below. Required A Required B Prepare a schedule of relevant sales and costs for Segment A. Relevant Revenue and Cost Items for Segment A Effect on income $ Required a. Prepare a schedule of relevant sales and costs for Segment A. b. Prepare comparative income statements for the company as a whole under two alternatives: (1) the retention of Segment A and (2) the elimination of Segment A. A $ 169,000 (123,000) (20,000) 26,000 (37,000) (5,000) $ (16,000) 0 B $242,000 (92,000) (32,000) 118,000 (35,000) (19,000) $ 64,000 с $ 262,000…arrow_forwardIndustry, Delete any companies with missing data for AT, SALE, IB Using Your industry (from question title), please answer these questions using Fiscal year 2015 data, use Total Assets (AT) for average investment, Income Before Extraordinary Items (IB) for income, and Sales/Turnover (Net) (SALE) for Sales Revenue What is the average Sales Margin for your industry? Answer in percentage, to the nearest hundredth of a percent, without the % sign, example 3.45 for 3.45%, 0.45 for 0.45% What is the average Turnover for your industry Answer to the nearest hundredth What is the average Return on Investment for your industry Answer in percentage, to the nearest hundredth of a percent, without the % sign, example 3.45 for 3.45% Which company (use Global Company Key) has the highest ROI in your Industry? Answer with no leading zeros using the appropriate number of digitsarrow_forward
arrow_back_ios
SEE MORE QUESTIONS
arrow_forward_ios
Recommended textbooks for you
- Financial AccountingAccountingISBN:9781337272124Author:Carl Warren, James M. Reeve, Jonathan DuchacPublisher:Cengage LearningCorporate Financial AccountingAccountingISBN:9781305653535Author:Carl Warren, James M. Reeve, Jonathan DuchacPublisher:Cengage LearningAccounting (Text Only)AccountingISBN:9781285743615Author:Carl Warren, James M. Reeve, Jonathan DuchacPublisher:Cengage Learning
- Financial And Managerial AccountingAccountingISBN:9781337902663Author:WARREN, Carl S.Publisher:Cengage Learning,Financial Accounting: The Impact on Decision Make...AccountingISBN:9781305654174Author:Gary A. Porter, Curtis L. NortonPublisher:Cengage LearningFinancial & Managerial AccountingAccountingISBN:9781337119207Author:Carl Warren, James M. Reeve, Jonathan DuchacPublisher:Cengage Learning
Financial Accounting
Accounting
ISBN:9781337272124
Author:Carl Warren, James M. Reeve, Jonathan Duchac
Publisher:Cengage Learning
Corporate Financial Accounting
Accounting
ISBN:9781305653535
Author:Carl Warren, James M. Reeve, Jonathan Duchac
Publisher:Cengage Learning
Accounting (Text Only)
Accounting
ISBN:9781285743615
Author:Carl Warren, James M. Reeve, Jonathan Duchac
Publisher:Cengage Learning
Financial And Managerial Accounting
Accounting
ISBN:9781337902663
Author:WARREN, Carl S.
Publisher:Cengage Learning,
Financial Accounting: The Impact on Decision Make...
Accounting
ISBN:9781305654174
Author:Gary A. Porter, Curtis L. Norton
Publisher:Cengage Learning
Financial & Managerial Accounting
Accounting
ISBN:9781337119207
Author:Carl Warren, James M. Reeve, Jonathan Duchac
Publisher:Cengage Learning
Financial ratio analysis; Author: The Finance Storyteller;https://www.youtube.com/watch?v=MTq7HuvoGck;License: Standard Youtube License