
Concept explainers
Videos
The coordinates of the vertex, focus and the equation of directrix.
Answer to Problem 1RE
The coordinates of the vertex is
Explanation of Solution
The given equation is
It is of the standard form
The coordinates of the focus is
Find the value of
Therefore, the coordinates of the focus is
Standard equation of directrix is
Hence, for the given equation
Therefore the coordinate of the vertex is
To sketch: The parabola and its directrix for the equation
Explanation of Solution
Procedure used:
To sketch a parabola for an equation in the form
1. Write the given equation in the standard form
2. Calculate the value of
3. Plot the vertex at
4. The directrix
5. Substitute the
6. With vertex at
Calculation:
The given equation is
From the above part
Therefore, the coordinate of focus and equation of directrix are
Substitute the value of
Taking square root on both sides.
Therefore, the points are
The parabola and its directrix is sketched as follows:
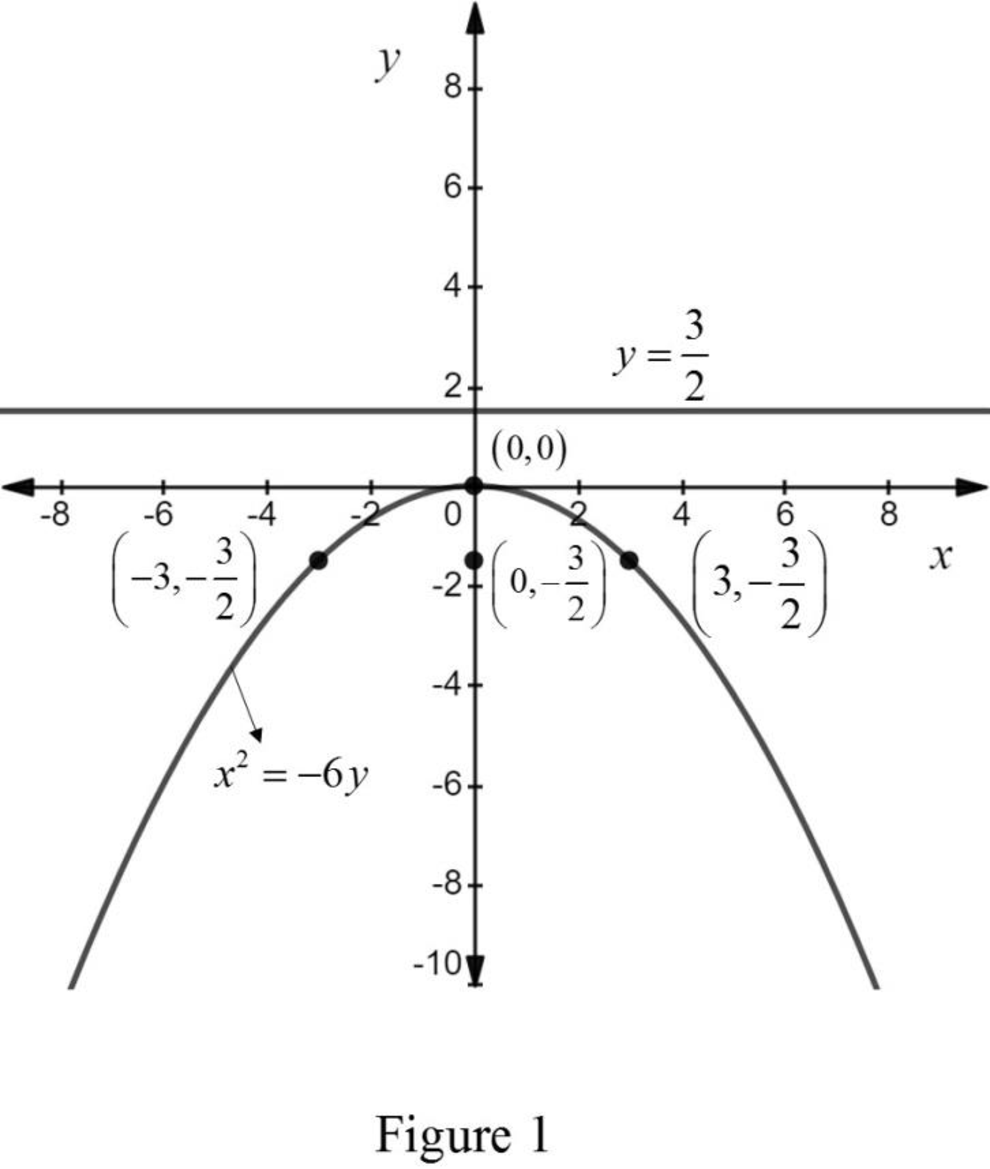
From the above graph it is observed that
Whether the given equation is a function or not.
Answer to Problem 1RE
The given equation
Explanation of Solution
Procedure used:
To check whether the given equation is a function or not:
1. Plot the graph for the given equation.
2. For the resulting graph, apply the vertical line test.
3. Check whether the vertical line touches the parabola at only one point.
4. If the above condition is true, then the given equation is a function otherwise it is not a function.
Calculation:
The graph for the given equation is drawn as given below.
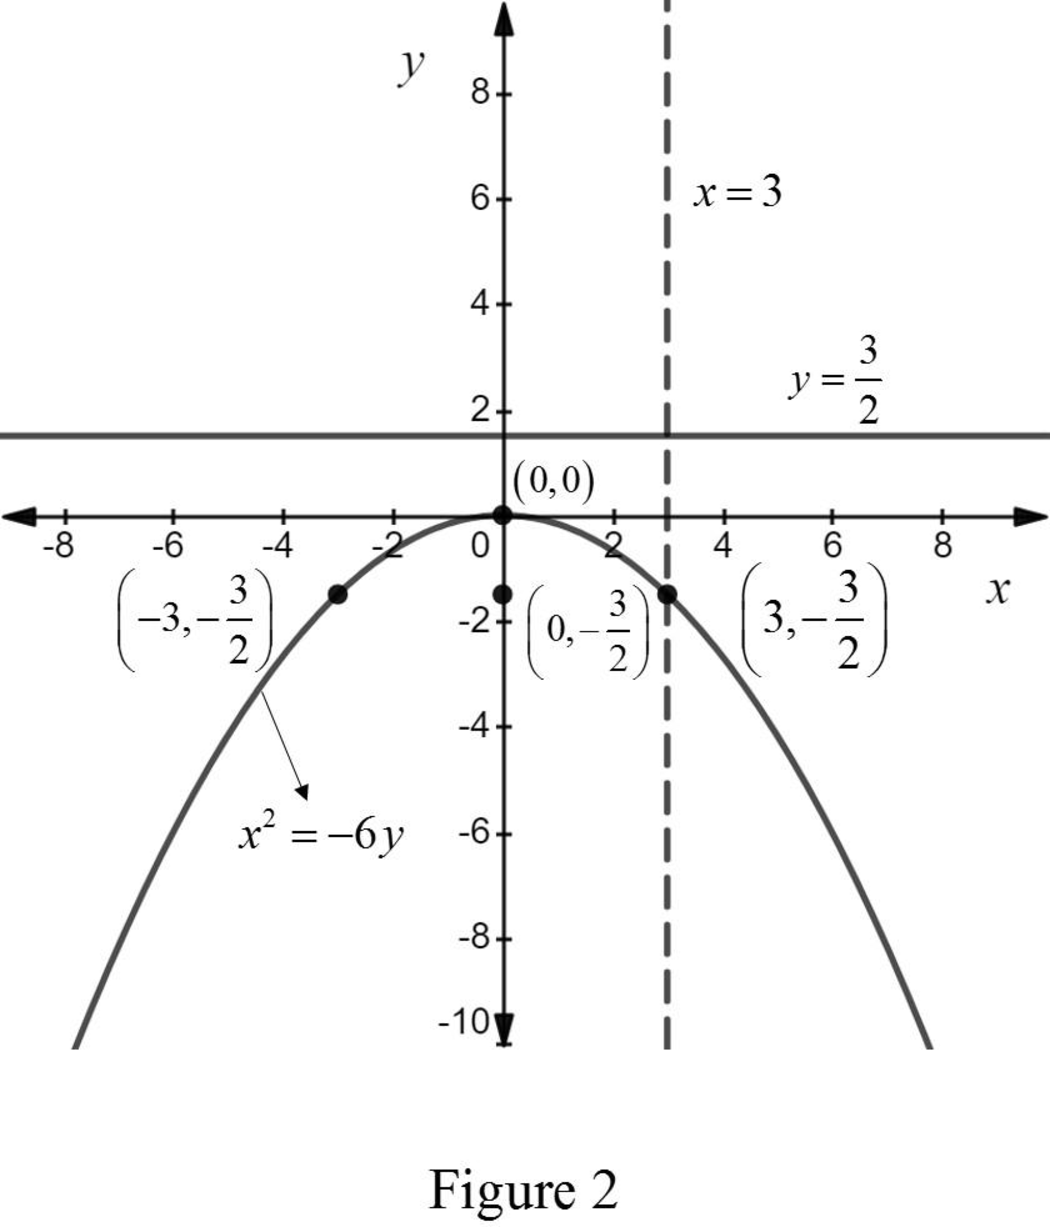
From the above figure it is observed that in the vertical line test the vertical line
Therefore, the equation
Want to see more full solutions like this?
Chapter D Solutions
Pearson eText for College Mathematics for Trades and Technologies -- Instant Access (Pearson+)


- To the Internal Revenue Service, the reasonableness of total itemized deductions depends on the taxpayer’s adjusted gross income. Large deductions, which include charity and medical deductions, are more reasonable for taxpayers with large adjusted gross incomes. If a taxpayer claims larger than average itemized deductions for a given level of income, the chances of an IRS audit are increased. Data (in thousands of dollars) on adjusted gross income and the average or reasonable amount of itemized deductions follow. Adjusted Gross Income ($1000s) Reasonable Amount ofItemized Deductions ($1000s) 22 9.6 27 9.6 32 10.1 48 11.1 65 13.5 85 17.7 120 25.5 Compute b1 and b0 (to 4 decimals).b1 b0 Complete the estimated regression equation (to 2 decimals). = + x Predict a reasonable level of total itemized deductions for a taxpayer with an adjusted gross income of $52.5 thousand (to 2 decimals). thousand dollarsWhat is the value, in dollars, of…arrow_forwardAnswer questions 8.1.10, 8.1.11and 8.1.12 respectivelyarrow_forward7.2.10 Researchers in the Hopkins Forest also count the number of maple trees (genus acer) in plots throughout the forest. The following is a histogram of the number of live maples in 1002 plots sampled over the past 20 years. The average number of maples per plot was 19.86 trees with a standard deviation of 23.65 trees. a. If we took the mean of a sample of eight plots, what would be the standard error of the mean? b. Using the central limit theorem, what is the probability that the mean of the eight would be within 1 standard error of the mean? c. Why might you think that the probability that you calculated in (b) might not be very accurate? 2. A normal population has mean 100 and variance 25. How large must the random sample be if you want the standard error of the sample average to be 1.5?arrow_forward
- Answer questions 7.3.10 and 7.3.12 respectively 7.3.12. Suppose that two independent random samples (of size n1 and n2) from two normal distributions are available. Explain how you would estimate the standard error of the difference in sample means X1 − X2 with the bootstrap method.arrow_forwardAnswer questions 7.4.6 and 7.4.7 respectivelyarrow_forwardWrite an equation for the function shown. You may assume all intercepts and asymptotes are on integers. The blue dashed lines are the asymptotes. 10 9- 8- 7 6 5 4- 3- 2 4 5 15-14-13-12-11-10 -9 -8 -7 -6 -5 -4 -3 -2 1 1 2 3 -1 -2 -3 -4 1 -5 -6- -7 -8- -9 -10+ 60 7 8 9 10 11 12 13 14 15arrow_forward
- K The mean height of women in a country (ages 20-29) is 63.7 inches. A random sample of 65 women in this age group is selected. What is the probability that the mean height for the sample is greater than 64 inches? Assume σ = 2.68. The probability that the mean height for the sample is greater than 64 inches is (Round to four decimal places as needed.)arrow_forwardAnswer questions 8.1.4, 8.1.5 and 8.1.6 respectivelyarrow_forwardAnswer questions 7.4.13, 7.4.14 and 7.4.15 respectivelyarrow_forward
 Discrete Mathematics and Its Applications ( 8th I...MathISBN:9781259676512Author:Kenneth H RosenPublisher:McGraw-Hill Education
 Mathematics for Elementary Teachers with Activiti...MathISBN:9780134392790Author:Beckmann, SybillaPublisher:PEARSON
 Thinking Mathematically (7th Edition)MathISBN:9780134683713Author:Robert F. BlitzerPublisher:PEARSON
 Discrete Mathematics With ApplicationsMathISBN:9781337694193Author:EPP, Susanna S.Publisher:Cengage Learning,
 Pathways To Math Literacy (looseleaf)MathISBN:9781259985607Author:David Sobecki Professor, Brian A. MercerPublisher:McGraw-Hill Education