
MyLab Statistics with Pearson eText -- Standalone Access Card -- for Fundamentals of Statistics
5th Edition
ISBN: 9780134743295
Author: Michael III Sullivan
Publisher: PEARSON
expand_more
expand_more
format_list_bulleted
Concept explainers
Videos
Textbook Question
Chapter B.2, Problem 15AYU
Peanuts A jar of peanuts is supposed to have 16 ounces of peanuts. The filling machine inevitably experiences fluctuations in filling, so a quality-control manager randomly samples 12 jars of peanuts from the storage facility and measures their contents. She obtains the following data:
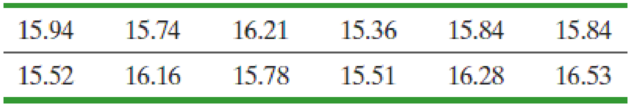
- (a) Verify that the data are
normally distributed by constructing a normalprobability plot. - (b) Determine the sample standard deviation.
- (c) Construct a 90% confidence interval for the population standard deviation of the number of ounces of peanuts.
- (d) The quality control manager wants the machine to have a population standard deviation below 0.20 ounce. Does the confidence interval validate this desire?
Expert Solution & Answer
Want to see the full answer?
Check out a sample textbook solution
Students have asked these similar questions
Suppose that you flip a fair coin four times. What’s the chance of getting at least one head?
Suppose that the chance that an elementary student eats hot lunch is 30 percent. What’s the chance that, among 20 randomly selected students, between 6 and 8 students eat hot lunch (inclusive)?
Bob’s commuting times to work are varied. He makes it to work on time 80 percent of the time. On 12 randomly selected trips to work, what’s the chance that Bob makes it on time at least 10 times?
Chapter B.2 Solutions
MyLab Statistics with Pearson eText -- Standalone Access Card -- for Fundamentals of Statistics
Ch. B.2 - True or False: The chi-square distribution is...Ch. B.2 - Prob. 2AYUCh. B.2 - Prob. 3AYUCh. B.2 - Prob. 4AYUCh. B.2 - Prob. 5AYUCh. B.2 - Prob. 6AYUCh. B.2 - In Problems 58, find the critical values 1/22 and...Ch. B.2 - Prob. 8AYUCh. B.2 - Prob. 9AYUCh. B.2 - A simple random sample of size n is drawn from a...
Ch. B.2 - NW 11. pH of Rain The following data represent the...Ch. B.2 - Travel Taxes Travelers pay taxes for flying, car...Ch. B.2 - Crash Test Results The following data represent...Ch. B.2 - Crawling Babies The following data represent the...Ch. B.2 - Peanuts A jar of peanuts is supposed to have 16...Ch. B.2 - Investment Risk Investors not only desire a high...Ch. B.2 - Critical Values Sir R. A. Fisher, a famous...
Knowledge Booster


Learn more about
Need a deep-dive on the concept behind this application? Look no further. Learn more about this topic, statistics and related others by exploring similar questions and additional content below.Similar questions
- Your chance of winning a small prize in a scratch-off ticket is 10 percent. You buy five tickets. What’s the chance you will win at least one prize?arrow_forwardSuppose that 60 percent of families own a pet. You randomly sample four families. What is the chance that two or three of them own a pet?arrow_forwardIf 40 percent of university students purchase their textbooks online, in a random sample of five students, what’s the chance that exactly one of them purchased their textbooks online?arrow_forward
- A stoplight is green 40 percent of the time. If you stop at this light eight random times, what is the chance that it’s green exactly five times?arrow_forwardIf 10 percent of the parts made by a certain company are defective and have to be remade, what is the chance that a random sample of four parts has one that is defective?arrow_forwardQuestion 4 Fourteen individuals were given a complex puzzle to complete. The times in seconds was recorded for their first and second attempts and the results provided below: 1 2 3 first attempt 172 255 second attempt 70 4 5 114 248 218 194 270 267 66 6 7 230 219 341 174 8 10 9 210 261 347 218 200 281 199 308 268 243 236 300 11 12 13 14 140 302 a. Calculate a 95% confidence interval for the mean time taken by each individual to complete the (i) first attempt and (ii) second attempt. [la] b. Test the hypothesis that the difference between the two mean times for both is 100 seconds. Use the 5% level of significance. c. Subsequently, it was learnt that the times for the second attempt were incorrecly recorded and that each of the values is 50 seconds too large. What, if any, difference does this make to the results of the test done in part (b)? Show all steps for the hypothesis testarrow_forward
- Question 3 3200 students were asked about the importance of study groups in successfully completing their courses. They were asked to provide their current majors as well as their opinion. The results are given below: Major Opinion Psychology Sociology Economics Statistics Accounting Total Agree 144 183 201 271 251 1050 Disagree 230 233 254 227 218 1162 Impartial 201 181 196 234 176 988 Total 575 597 651 732 645 3200 a. State both the null and alternative hypotheses. b. Provide the decision rule for making this decision. Use an alpha level of 5%. c. Show all of the work necessary to calculate the appropriate statistic. | d. What conclusion are you allowed to draw? c. Would your conclusion change at the 10% level of significance? f. Confirm test results in part (c) using JASP. Note: All JASP input files and output tables should be providedarrow_forwardQuestion 1 A tech company has acknowledged the importance of having records of all meetings conducted. The meetings are very fast paced and requires equipment that is able to capture the information in the shortest possible time. There are two options, using a typewriter or a word processor. Fifteen administrative assistants are selected and the amount of typing time in hours was recorded. The results are given below: 1 2 3 4 5 6 7 8 9 10 11 12 13 14 15 typewriter 8.0 6.5 5.0 6.7 7.8 8.5 7.2 5.7 9.2 5.7 6.5 word processor 7.2 5.7 8.3 7.5 9.2 7.2 6.5 7.0 6.9 34 7.0 6.9 8.8 6.7 8.8 9.4 8.6 5.5 7.2 8.4 a. Test the hypothesis that the mean typing time in hours for typewriters is less than 7.0. Use the 1% level of significance. b. Construct a 90% confidence interval for the difference in mean typing time in hours, where a difference is equal to the typing time in hours of word processors minus typing time in hours of typewriter. c. Using the 5% significance level, determine whether there is…arrow_forwardIllustrate 2/7×4/5 using a rectangular region. Explain your work. arrow_forward
- Write three other different proportions equivalent to the following using the same values as in the given proportion 3 foot over 1 yard equals X feet over 5 yardsarrow_forward2. An experiment is set up to test the effectiveness of a new drug for balancing people's mood. The table below contains the results of the patients before and after taking the drug. The possible scores are the integers from 0 to 10, where 0 indicates a depressed mood and 10 indicates and elated mood. Patient Before After 1 4 4 2 3 3 3 6 4 4 1 2 5 6 5 6 1 3 7 4 7 8 6 9 1 4 10 5 4 Assuming the differences of the observations to be symmetric, but not normally distributed, investigate the effectiveness of the drug at the 5% significance level. [4 Marks]arrow_forward3. (i) Consider the following R code: wilcox.test(UK Supermarkets $Salary ~ UKSupermarkets $Supermarket) (a) Which test is being used in this code? (b) What is the name of the dataset under consideration? How would be adapt this code if we had ties? What other command can be used which deals with ties? (ii) Consider the following R code: install packages("nortest") library(nortest) lillie.test (Differences) (a) Assuming the appropriate dataset has been imported and attached, what is wrong with this code? (b) If this code were to be corrected, what would be determined by run- ning it? [3 Marks]arrow_forward
arrow_back_ios
SEE MORE QUESTIONS
arrow_forward_ios
Recommended textbooks for you
 Glencoe Algebra 1, Student Edition, 9780079039897...AlgebraISBN:9780079039897Author:CarterPublisher:McGraw Hill
Glencoe Algebra 1, Student Edition, 9780079039897...
Algebra
ISBN:9780079039897
Author:Carter
Publisher:McGraw Hill
Statistics 4.1 Point Estimators; Author: Dr. Jack L. Jackson II;https://www.youtube.com/watch?v=2MrI0J8XCEE;License: Standard YouTube License, CC-BY
Statistics 101: Point Estimators; Author: Brandon Foltz;https://www.youtube.com/watch?v=4v41z3HwLaM;License: Standard YouTube License, CC-BY
Central limit theorem; Author: 365 Data Science;https://www.youtube.com/watch?v=b5xQmk9veZ4;License: Standard YouTube License, CC-BY
Point Estimate Definition & Example; Author: Prof. Essa;https://www.youtube.com/watch?v=OTVwtvQmSn0;License: Standard Youtube License
Point Estimation; Author: Vamsidhar Ambatipudi;https://www.youtube.com/watch?v=flqhlM2bZWc;License: Standard Youtube License