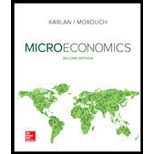
Microeconomics
2nd Edition
ISBN: 9781259813337
Author: KARLAN, Dean S., Morduch, Jonathan
Publisher: Mcgraw-hill Education,
expand_more
expand_more
format_list_bulleted
Question
Chapter B, Problem 7PA
To determine
To rearrange: the equation Q= 5-0.25P in the graph and to determine whether it is a
Expert Solution & Answer
Want to see the full answer?
Check out a sample textbook solution
Students have asked these similar questions
corospond to this message.
Gross Domestic Product (GDP) represents the total value of all goods and services produced by a country. The news reporter shows excitement because rising GDP signifies positive economic performance. Consumer spending has increased while businesses expand and new job opportunities become available. If the GDP rises, your delivery business will likely handle more packages as consumer purchasing increases. The increase in business activity will lead to more opportunities for your company to generate higher profits. You may need to take action by hiring additional staff and purchasing extra delivery vehicles or finding ways to improve your operation speed and efficiency to meet increased demand.
Please show work / explain how you get answer as well. Thank you!
Please show work / explain how you get answer as well. Thank you!
Knowledge Booster
Similar questions
- ??!!arrow_forward. What the heck is this GDP thingy? It is Thursday afternoon, just a few days before the holiday season starts in your region, and you decided to visit your uncle Chao who owns a local delivery company. While sitting in the living room watching the evening news with your uncle, you heard the news reporter stating the following with an optimistic tone: "According to recent studies, gross domestic product (GDP) is rising due to an increase in consumer spending. The increase in spending was due to an increase in consumer confidence because the job market has shown a positive increase in both employment and income." Immediately, your uncle Chao looked at you with some confusion on his face and asked: What the heck is GDP, and why does the news dude seem excited about its increase? Does this “good” change in this GDP thingy have any effect on my delivery business? How? Do I need to do something different to prepare for the rise in GDP? How?arrow_forward3. I need people who don’t want me! As an operations manager at a factory that produces manual tools, you were tasked with preparing a new site for expansion. The plan is to start production in the new location within 6 months from the current date. The new location requires 100 workers to operate fully. The workers you need don’t require any form of education or special skills because the tasks at the factory are simple and straightforward. In other words, you typically hire lower-skilled workers. In recent years, your company has been having problems finding workers who meet those criteria because the demand for them is so high. While sitting in your office, your teammate, Alejandra, walked to your office and said, "Have you heard the recent news about the economy? They said that investment has declined, and government spending has declined too. They also said that GDP is expected to shrink in the next 6 to 10 months. I wonder what is next." Then, she looked at you and said: How…arrow_forward
- X Apex Learning Courses public activity 003002 assessment K! Kahoot! 11.3.2 Quiz: Specialization Question 5 of 10 Which term describes a business's decision to focus on producing a small number of products? A. Opportunity cost B. Specialization C. Voluntary exchange D. Self-sufficiency PREVIOUS SUBMITarrow_forwardApex Learning Apex Learning Courses leaming.com/public/activity/1003002/assessment QQuizlet K! Kahoot! 1.3.2 Quiz: Specialization Question 5 of 10 Which term describes a business's decision to focus on producing a small number of products? OO A. Opportunity cost B. Specialization C. Voluntary exchange D. Self-sufficiency PREVIOUS SUBMITarrow_forwardnot use ai pleasearrow_forward
arrow_back_ios
SEE MORE QUESTIONS
arrow_forward_ios
Recommended textbooks for you
 Exploring EconomicsEconomicsISBN:9781544336329Author:Robert L. SextonPublisher:SAGE Publications, Inc

 Economics (MindTap Course List)EconomicsISBN:9781337617383Author:Roger A. ArnoldPublisher:Cengage Learning
 Managerial Economics: A Problem Solving ApproachEconomicsISBN:9781337106665Author:Luke M. Froeb, Brian T. McCann, Michael R. Ward, Mike ShorPublisher:Cengage Learning

Exploring Economics
Economics
ISBN:9781544336329
Author:Robert L. Sexton
Publisher:SAGE Publications, Inc


Economics (MindTap Course List)
Economics
ISBN:9781337617383
Author:Roger A. Arnold
Publisher:Cengage Learning

Managerial Economics: A Problem Solving Approach
Economics
ISBN:9781337106665
Author:Luke M. Froeb, Brian T. McCann, Michael R. Ward, Mike Shor
Publisher:Cengage Learning
