
Concept explainers
Videos
In some cases, users want to use Access and Excel together. They process relational data with Access, import some of the data into Excel, and use Excel’s tools for creating professional-looking charts and graphs. You will do exactly that in this exercise.
FIGURE AE-3 Data Displayed in Pie-Chart Format
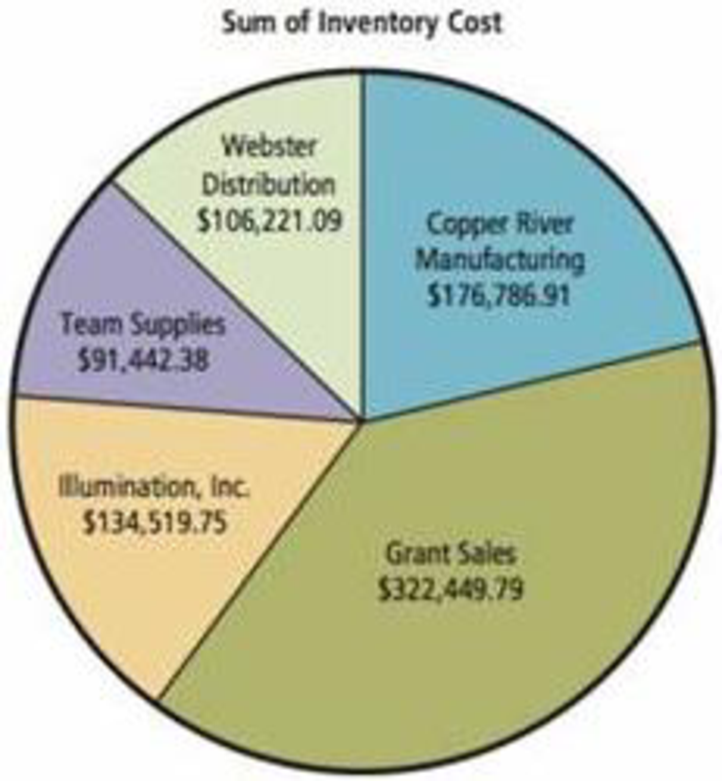
Source: Microsoft Corporation
Download the Access file Ch05Ex01_U10e.accdb. Open the
For this problem, we will define InventoryCost as the product of Industry-Standard-Cost and QuantityOnHand. The query InventoryCost computes these values for every item in inventory for every vendor. Open that query and view the data to be certain you understand this computation. Open the other queries as well so that you understand the data they produce.
- a. Sum this data by vendor and display it in a pie chart like that shown in Figure AE-3 (your totals will be different from those shown). Proceed as follows:
- (1) Open Excel and create a new spreadsheet.
- (2) Click DATA on the ribbon and select From Access in the Get External Data ribbon category.
- (3) Navigate to the location in which you have stored the Access file Ch05Ex01_U10e.accdb.
- (4) Select the query that contains the data you need for this pie chart.
- (5) Import the data into a worksheet.
- (6) Format the appropriate data as currency.
- (7) Select the range that contains the data, press the Function key, and proceed from there to create the pie chart. Name the data and pie chart worksheets appropriately.
h. Follow a similar procedure to create the bar chart shown in Figure AE-4. Again, your data will be different. Place the data and the chart in separate worksheets and name them appropriately.
FIGURE AE-4 Data Displayed in Bar-Chart Format
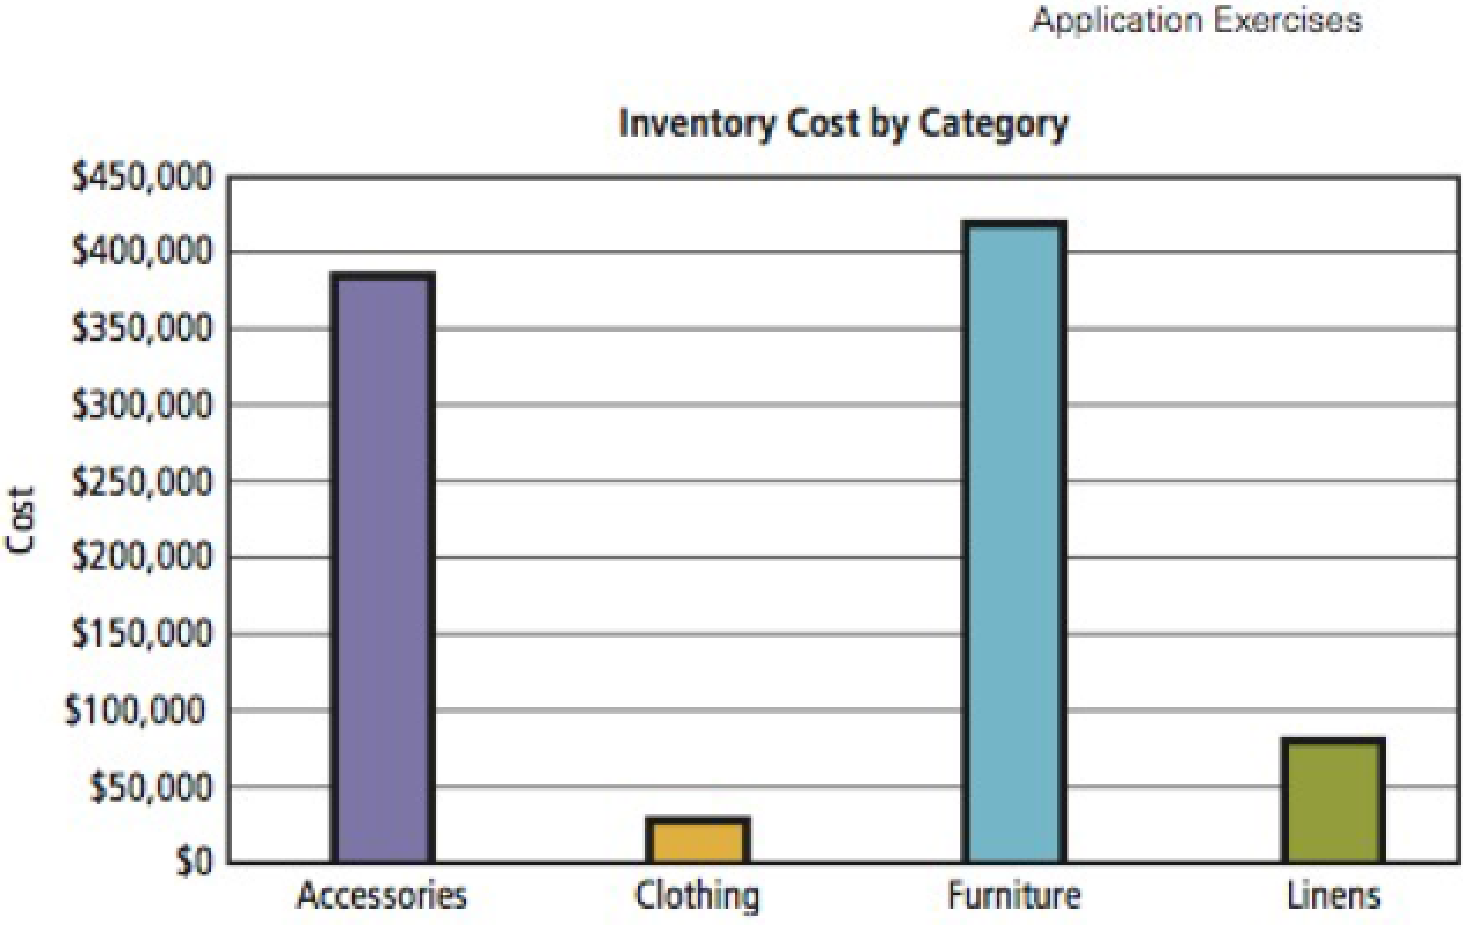
Source: Microsoft Corporation
Want to see the full answer?
Check out a sample textbook solution
Chapter AE Solutions
EBK USING MIS
Additional Engineering Textbook Solutions
Starting Out with Programming Logic and Design (5th Edition) (What's New in Computer Science)
SURVEY OF OPERATING SYSTEMS
Database Concepts (8th Edition)
Modern Database Management
Automotive Technology: Principles, Diagnosis, And Service (6th Edition) (halderman Automotive Series)
Thinking Like an Engineer: An Active Learning Approach (4th Edition)


- The following relations keep track of airline flight information: Flights(flno: integer, from: string, to: string, distance: integer, departs: time, arrives: time, price: integer) Aircraft(aid: integer, aname: string, cruisingrange: integer) Certified(eid: integer, aid: integer) Employees(eid: integer, ename: string, salary: integer) Note that the Employees relation describes pilots and other kinds of employees as well; every pilot is certified for some aircraft, and only pilots are certified to fly. Write each of the following queries in SQL.(Additional queries using the same schema are listed in the exercises for Chapter 4) a. Identify the routes that can be piloted by every pilot who makes more than $100,000. b. Print the name and salary of every nonpilot whose salary is more than the average salary for pilots. c. Print the names of employees who are certified only on aircrafts with cruising range longer than 1000 miles and who are certified on some Boeing…arrow_forwardNeed help making python code for this!arrow_forward2.7 LAB: Smallest of two numbers Instructor note: Note: this section of your textbook contains activities that you will complete for points. To ensure your work is scored, please access this page from the assignment link provided in the CTU Virtual Campus. If you did not access this page via the CTU Virtual Campus, please do so now.arrow_forward
- I help understanding this question d'y + 4dy +3y = a, Initial Conditions: y(0) = 5 & y'(0)=0 Where a = 10 a) Find y(t) =yh(t) +yp(t) in time domainIs the system over-damped, under-damped, or critical? b) Find y(t) using Laplace Transformsarrow_forwardGiven f(t)=a sin(ßt) a = 10 & ß = 23 Find the Laplace Transform using the definition F(s) = ∫f(t)e-stdtarrow_forwardPlease do not use any AI tools to solve this question. I need a fully manual, step-by-step solution with clear explanations, as if it were done by a human tutor. No AI-generated responses, please.arrow_forward
- Obtain the MUX design for the function F(X,Y,Z) = (0,3,4,7) using an off-the-shelf MUX with an active low strobe input (E).arrow_forwardI cannot program smart home automation rules from my device using a computer or phone, and I would like to know how to properly connect devices such as switches and sensors together ? Cisco Packet Tracer 1. Smart Home Automation:o Connect a temperature sensor and a fan to a home gateway.o Configure the home gateway so that the fan is activated when the temperature exceedsa set threshold (e.g., 30°C).2. WiFi Network Configuration:o Set up a wireless LAN with a unique SSID.o Enable WPA2 encryption to secure the WiFi network.o Implement MAC address filtering to allow only specific clients to connect.3. WLC Configuration:o Deploy at least two wireless access points connected to a Wireless LAN Controller(WLC).o Configure the WLC to manage the APs, broadcast the configured SSID, and applyconsistent security settings across all APs.arrow_forwardusing r language for integration theta = integral 0 to infinity (x^4)*e^(-x^2)/2 dx (1) use the density function of standard normal distribution N(0,1) f(x) = 1/sqrt(2pi) * e^(-x^2)/2 -infinity <x<infinity as importance function and obtain an estimate theta 1 for theta set m=100 for the estimate whatt is the estimate theta 1? (2)use the density function of gamma (r=5 λ=1/2)distribution f(x)=λ^r/Γ(r) x^(r-1)e^(-λx) x>=0 as importance function and obtain an estimate theta 2 for theta set m=1000 fir the estimate what is the estimate theta2? (3) use simulation (repeat 1000 times) to estimate the variance of the estimates theta1 and theta 2 which one has smaller variance?arrow_forward
- using r language A continuous random variable X has density function f(x)=1/56(3x^2+4x^3+5x^4).0<=x<=2 (1) secify the density g of the random variable Y you find for the acceptance rejection method. (2) what is the value of c you choose to use for the acceptance rejection method (3) use the acceptance rejection method to generate a random sample of size 1000 from the distribution of X .graph the density histogram of the sample and compare it with the density function f(x)arrow_forwardusing r language a continuous random variable X has density function f(x)=1/4x^3e^-(pi/2)^4,x>=0 derive the probability inverse transformation F^(-1)x where F(x) is the cdf of the random variable Xarrow_forwardusing r language in an accelerated failure test, components are operated under extreme conditions so that a substantial number will fail in a rather short time. in such a test involving two types of microships 600 chips manufactured by an existing process were tested and 125 of them failed then 800 chips manufactured by a new process were tested and 130 of them failed what is the 90%confidence interval for the difference between the proportions of failure for chips manufactured by two processes? using r languagearrow_forward
 Np Ms Office 365/Excel 2016 I NtermedComputer ScienceISBN:9781337508841Author:CareyPublisher:Cengage
 A Guide to SQLComputer ScienceISBN:9781111527273Author:Philip J. PrattPublisher:Course Technology Ptr
 Database Systems: Design, Implementation, & Manag...Computer ScienceISBN:9781305627482Author:Carlos Coronel, Steven MorrisPublisher:Cengage Learning
 Database Systems: Design, Implementation, & Manag...Computer ScienceISBN:9781285196145Author:Steven, Steven Morris, Carlos Coronel, Carlos, Coronel, Carlos; Morris, Carlos Coronel and Steven Morris, Carlos Coronel; Steven Morris, Steven Morris; Carlos CoronelPublisher:Cengage Learning