
Videos
(a)
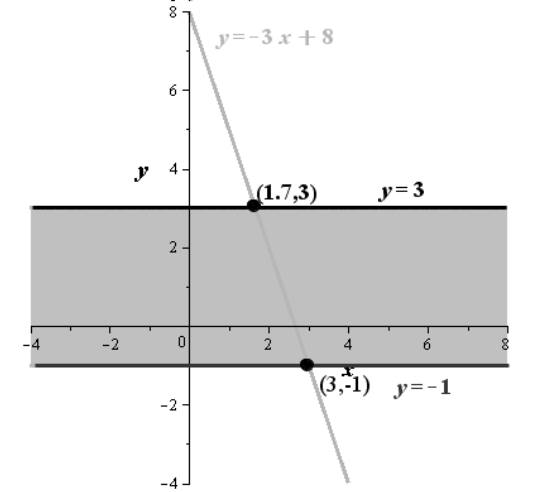
Solve the inequality and graph the solution set.
(a)
Answer to Problem 72E
The answer is
The graph is shown below
Explanation of Solution
Given:
Consider the equation
Solving it graphically, both of them intersect at the point
The shaded area shows that the solution lies below the line
Therefore, the value of
The answer is
(b)
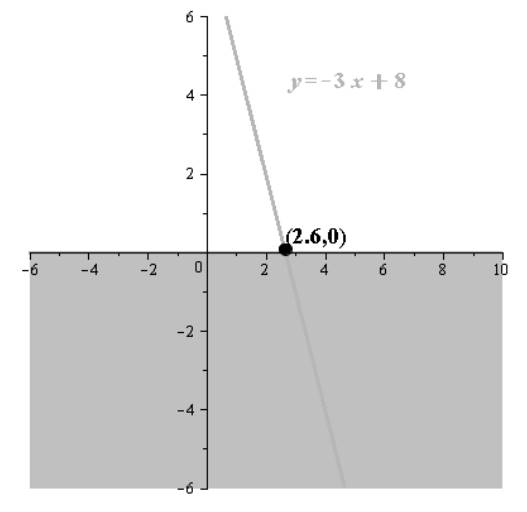
Solve the inequality and graph the solution set.
(b)
Answer to Problem 72E
The answer is
The graph is shown below
Explanation of Solution
Given:
Consider the equation
Solving it graphically, both of them intersect at the point
The shaded area shows that the solution lies above the line
Therefore, the value of
The answer is
Chapter A Solutions
EBK PRECALCULUS W/LIMITS


- Use the method of washers to find the volume of the solid that is obtained when the region between the graphs f(x) = √√2 and g(x) = secx over the interval ≤x≤ is rotated about the x-axis.arrow_forward5 Use the method of disks to find the volume of the solid that is obtained when the region under the curve y = over the interval [4,17] is rotated about the x-axis.arrow_forward3. Use the method of washers to find the volume of the solid that is obtained when the region between the graphs f(x) = √√2 and g(x) = secx over the interval ≤x≤ is rotated about the x-axis.arrow_forward
- 4. Use cylindrical shells to find the volume of the solid generated when the region enclosed by the given curves is revolved about the x-axis. y = √√x, y = 0, y = √√3arrow_forward5 4 3 21 N -5-4-3-2 -1 -2 -3 -4 1 2 3 4 5 -5+ Write an equation for the function graphed above y =arrow_forward6 5 4 3 2 1 -5 -4-3-2-1 1 5 6 -1 23 -2 -3 -4 -5 The graph above is a transformation of the function f(x) = |x| Write an equation for the function graphed above g(x) =arrow_forward
- The graph of y x² is shown on the grid. Graph y = = (x+3)² – 1. +10+ 69 8 7 5 4 9 432 6. 7 8 9 10 1 10 -9 -8 -7 -6 -5 -4 -3 -2 -1 1 2 3 4 5 -2 -3 -4 -5 -6- Clear All Draw:arrow_forwardSketch a graph of f(x) = 2(x − 2)² − 3 4 3 2 1 5 ས་ -5 -4 -3 -2 -1 1 2 3 4 -1 -2 -3 -4 -5+ Clear All Draw:arrow_forward5. Find the arc length of the curve y = 3x³/2 from x = 0 to x = 4.arrow_forward
- -6 -5 * 10 8 6 4 2 -2 -1 -2 1 2 3 4 5 6 -6 -8 -10- The function graphed above is: Concave up on the interval(s) Concave down on the interval(s) There is an inflection point at:arrow_forward6 5 4 3 2 1 -6 -5 -3 -2 3 -1 -2 -3 -4 -5 The graph above is a transformation of the function x² Write an equation for the function graphed above g(x) =arrow_forward6 5 4 3 2 1 -1 -1 -2 -3 -4 A -5 -6- The graph above shows the function f(x). The graph below shows g(x). 6 5 4 3 2 1 3 -1 -2 -3 -4 -5 -6 | g(x) is a transformation of f(x) where g(x) = Af(Bx) where: A = B =arrow_forward
 Calculus: Early TranscendentalsCalculusISBN:9781285741550Author:James StewartPublisher:Cengage Learning
 Thomas' Calculus (14th Edition)CalculusISBN:9780134438986Author:Joel R. Hass, Christopher E. Heil, Maurice D. WeirPublisher:PEARSON
 Calculus: Early Transcendentals (3rd Edition)CalculusISBN:9780134763644Author:William L. Briggs, Lyle Cochran, Bernard Gillett, Eric SchulzPublisher:PEARSON
 Calculus: Early TranscendentalsCalculusISBN:9781319050740Author:Jon Rogawski, Colin Adams, Robert FranzosaPublisher:W. H. Freeman
 Calculus: Early Transcendental FunctionsCalculusISBN:9781337552516Author:Ron Larson, Bruce H. EdwardsPublisher:Cengage Learning