Videos
| In Exercises 1-6, do the following: | |
| a. | Determine the number of vertices edges, and loops in the given graph |
| b. | Draw another representation of the graph that looks significantly different. |
| c. | Find two adjacent edges. |
| d. | Find two adjacent vertices |
| e. | Find the degree of each vertex. |
| f. | Determine whether the graph is connected. |
 |
|
a)
The number of vertices, edges, and loops in the given graph.
Answer to Problem 1CR
Solution:
The number of vertices are
Explanation of Solution
Given:
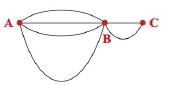
The following figure shows the given diagram.
Figure
Approach:
A graph is the diagram that consists of points, known as vertices, and connecting lines are known as edges. The edge that connects a vertex with itself is called a loop.
Therefore, the number of vertices are
Conclusion:
Hence, the number of vertices are
b)
To draw:
The representation of the graph that looks significantly different.
Answer to Problem 1CR
Solution:
The representation of the graph that looks significantly different is shown in figure
Explanation of Solution
Approach:
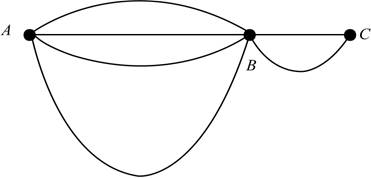
The significantly different representation is as follows,
Take three vertices as A, B and C. Connect A and B with two edges, A and C with two edges. Make an edge between B and C. To form a loop make an edge that connects the vertex B with each other as shown below.
Figure
Therefore, the representation of the graph that looks significantly different is shown in figure
Conclusion:
Hence, the representation of the graph that looks significantly different is shown in figure
c)
To find:
The two adjacent edges of the given figure.
Answer to Problem 1CR
Solution:
The adjacent sides are AB, BC.
Explanation of Solution
Approach:
Adjacent edges are the edges which have a common vertex.
In the above given figure the adjacent sides are AB, BC.
Therefore, the adjacent sides are AB, BC.
Conclusion:
Hence, the adjacent sides are AB, BC.
d)
To find:
The two adjacent vertices.
Answer to Problem 1CR
Solution:
The vertices A and B, B and C are two adjacent vertices.
Explanation of Solution
Approach:
Two vertices will be adjacent if they are joined by an edge.
Thus in the above given figure Vertices A and B, B and C are two adjacent vertices.
Therefore, the vertices A and B, B and C are two adjacent vertices.
Conclusion:
Hence, the vertices A and B, B and C are two adjacent vertices.
e)
To find:
The degree of each vertex.
Answer to Problem 1CR
Solution:
The degree of each vertex is shown in the table (1).
Explanation of Solution
Approach:
The degree of vertex is defined as the total number of edges that are connected to it.
The degree of vertex is shown in the following table.
| Vertex | Degree |
| A | |
| B | |
| C |
Table (1)
Therefore, the degree of each vertex is shown in the table (1).
Conclusion:
Hence, the degree of each vertex is shown in the table (1).
f)
Whether the graph is connected or not.
Answer to Problem 1CR
Solution:
The given graph is said to be connected.
Explanation of Solution
Approach:
A graph will be connected if every pair of vertices in the graph is connected by a trail. A trail is sequence of adjacent vertices and the distinct edges that connect to them. Consider the above graph. There is a trail of
Therefore, the given graph is said to be connected.
Conclusion:
Hence, the given graph is said to be connected.
Want to see more full solutions like this?
Chapter 9 Solutions
Mathematics: A Practical Odyssey


- Determine whether each function is an injection and determine whether each is a surjection.arrow_forwardLet A = {a, b, c, d}, B = {a,b,c}, and C = {s, t, u,v}. Draw an arrow diagram of a function for each of the following descriptions. If no such function exists, briefly explain why. (a) A function f : AC whose range is the set C. (b) A function g: BC whose range is the set C. (c) A function g: BC that is injective. (d) A function j : A → C that is not bijective.arrow_forwardLet f:R->R be defined by f(x)=x^(3)+5.(a) Determine if f is injective. why?(b) Determine if f is surjective. why?(c) Based upon (a) and (b), is f bijective? why?arrow_forward
- 25-30. Normal and tangential components For the vector field F and curve C, complete the following: a. Determine the points (if any) along the curve C at which the vector field F is tangent to C. b. Determine the points (if any) along the curve C at which the vector field F is normal to C. c. Sketch C and a few representative vectors of F on C. 25. F = (2½³, 0); c = {(x, y); y − x² = 1} 26. F = x (23 - 212) ; C = {(x, y); y = x² = 1}) , 2 27. F(x, y); C = {(x, y): x² + y² = 4} 28. F = (y, x); C = {(x, y): x² + y² = 1} 29. F = (x, y); C = 30. F = (y, x); C = {(x, y): x = 1} {(x, y): x² + y² = 1}arrow_forward٣/١ B msl kd 180 Ka, Sin (1) I sin () sin(30) Sin (30) اذا ميريد شرح الكتب بس 0 بالفراغ 3) Cos (30) 0.866 4) Rotating 5) Synchronous speed, 120 x 50 G 5005 1000 s = 1000-950 Copper bosses 5kW Rotor input 5 0.05 : loo kw 6) 1 /0001 ined sove in peaper I need a detailed solution on paper please وه اذا ميريد شرح الكتب فقط ١٥٠ DC 7) rotor a ' (y+xlny + xe*)dx + (xsiny + xlnx + dy = 0. Q1// Find the solution of: ( 357arrow_forward۳/۱ R₂ = X2 2) slots per pole per phase 3/31 B. 180 msl Kas Sin (I) 1sin() sin(30) Sin (30) اذا ميريد شرح الكتب بس 0 بالفراغ 3) Cos (30): 0.866 4) Rotating 5) Synchronous speeds 120×50 looo G 1000-950 1000 Copper losses 5kw Rotor input 5 loo kw 0.05 6) 1 اذا ميريد شرح الكتب فقط look 7) rotor DC ined sove in peaper I need a detailed solution on paper please 0 64 Find the general solution of the following equations: QI//y(4)-16y= 0. Find the general solution of the following equations: Q2ll yll-4y/ +13y=esinx.arrow_forward
- R₂ = X2 2) slots per pole per phase = 3/31 B-180 60 msl kd Kas Sin () 2 I sin (6) sin(30) Sin (30) اذا مريد شرح الكتب بس 0 بالفراغ 3 Cos (30) 0.866 4) Rotating ined sove in peaper 5) Synchronous speed s 120×50 6 s = 1000-950 1000 Copper losses 5kw Rotor input 5 0.05 6) 1 loo kw اذا ميريد شرح الكتب فقط Look 7) rotov DC I need a detailed solution on paper please 0 64 Solve the following equations: 0 Q1// Find the solution of: ( y • with y(0) = 1. dx x²+y²arrow_forwardR₂ = X2 2) slots per pole per phase = 3/3 1 B-180-60 msl Ka Sin (1) Isin () sin(30) Sin (30) اذا ميريد شرح الكتب بس 0 بالفراغ 3) Cos (30) 0.866 4) Rotating 5) Synchronous speed, 120 x 50 s = 1000-950 1000 Copper losses 5kw Rotor input 5 6) 1 0.05 G 50105 loo kw اذا ميريد شرح الكتب فقط look 7) rotov DC ined sove in peaper I need a detailed solution on paper please 064 2- A hot ball (D=15 cm ) is cooled by forced air T.-30°C, the rate of heat transfer from the ball is 460.86 W. Take for the air -0.025 Wim °C and Nu=144.89, find the ball surface temperature a) 300 °C 16 b) 327 °C c) 376 °C d) None か = 750 01arrow_forwardAnswer questions 8.3.3 and 8.3.4 respectively 8.3.4 .WP An article in Medicine and Science in Sports and Exercise [“Electrostimulation Training Effects on the Physical Performance of Ice Hockey Players” (2005, Vol. 37, pp. 455–460)] considered the use of electromyostimulation (EMS) as a method to train healthy skeletal muscle. EMS sessions consisted of 30 contractions (4-second duration, 85 Hz) and were carried out three times per week for 3 weeks on 17 ice hockey players. The 10-meter skating performance test showed a standard deviation of 0.09 seconds. Construct a 95% confidence interval of the standard deviation of the skating performance test.arrow_forward
 Algebra & Trigonometry with Analytic GeometryAlgebraISBN:9781133382119Author:SwokowskiPublisher:Cengage
 Algebra: Structure And Method, Book 1AlgebraISBN:9780395977224Author:Richard G. Brown, Mary P. Dolciani, Robert H. Sorgenfrey, William L. ColePublisher:McDougal Littell
 Elementary Geometry For College Students, 7eGeometryISBN:9781337614085Author:Alexander, Daniel C.; Koeberlein, Geralyn M.Publisher:Cengage,
 College Algebra (MindTap Course List)AlgebraISBN:9781305652231Author:R. David Gustafson, Jeff HughesPublisher:Cengage Learning