
Concept explainers
Videos
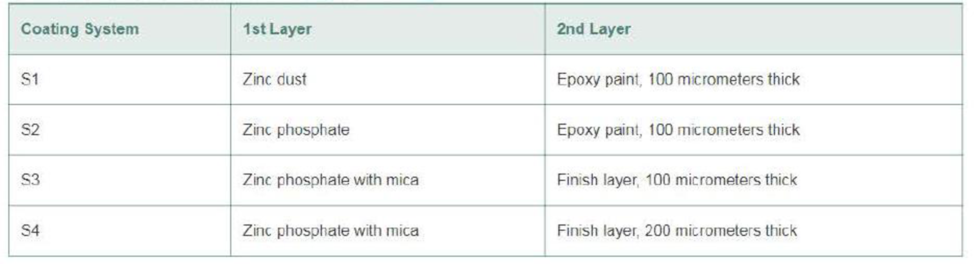
Anticorrosive behavior of steel coated with epoxy. Organic coatings that use epoxy resins are widely used for protecting steel and metal against weathering and corrosion. Researchers at National Technical University (Athens. Greece) examined the steel anticorrosive behavior of different epoxy coatings formulated with zinc pigments in an attempt to find the epoxy coating with the best corrosion inhibition (Pigment & Resin Technology, Vo. 32, 2003). The experimental units were flat rectangular panels cut from steel sheets. Each panel was coated with one of four different coating systems. S1, S2, S3, and S4. Three panels were prepared for each coating system. (These panels are labeled S1-A, S1-B, S1-C. S2-A, S2-B.....S4-C.) The characteristics of the four coating systems are listed at the bottom of the page. Each coated panel was immersed in deionized and deaerated water and then tested for corrosion. Because exposure time is likely to have a strong influence on anticorrosive behavior the researchers attempted to remove this extraneous source of variation through the experimental design. Exposure times were fixed at 24 hours, 60 days, and 120 days. For each of the coating systems, one panel was exposed to water for 24 hours, one exposed to water for 60 days, and one exposed to water for 120 days in random order. The design is illustrated in :he accompanying table.
| Exposure Time | Coating System/Panel Exposed |
| 24 hours | S1-A, S2-C, S3-C, S4-B |
| 60 days | S1-C, S2-A, S3-B, S4-A |
| 120 days | S1-B, S2-B, S3-A, S4-C |
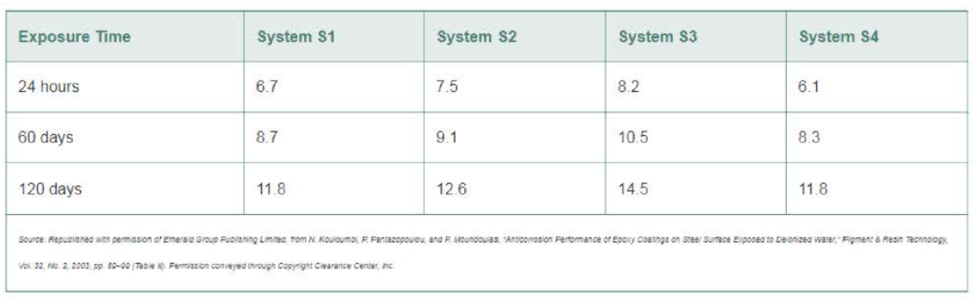
Following exposure, the corrosion rate (nanoamperes per square centimeter) was determined for each panel. The lower the corrosion rate, the greater the anticorrosion performance of the coating system. The data are shown in the next table. Are there differences among the epoxy treatment means? If so, which of the epoxy coating systems yields the lowest corrosion rate?
Coating systems characteristics for Exercise 9.63
Want to see the full answer?
Check out a sample textbook solution
Chapter 9 Solutions
EP STATISTICS F/BUS.+ECON.-ACCESS 18 WK


- I need help with this problem and an explanation of the solution for the image described below. (Statistics: Engineering Probabilities)arrow_forwardI need help with this problem and an explanation of the solution for the image described below. (Statistics: Engineering Probabilities)arrow_forwardDATA TABLE VALUES Meal Price ($) 22.78 31.90 33.89 22.77 18.04 23.29 35.28 42.38 36.88 38.55 41.68 25.73 34.19 31.75 25.24 26.32 19.57 36.57 32.97 36.83 30.17 37.29 25.37 24.71 28.79 32.83 43.00 35.23 34.76 33.06 27.73 31.89 38.47 39.42 40.72 43.92 36.51 45.25 33.51 29.17 30.54 26.74 37.93arrow_forward
- I need help with this problem and an explanation of the solution for the image described below. (Statistics: Engineering Probabilities)arrow_forwardSales personnel for Skillings Distributors submit weekly reports listing the customer contacts made during the week. A sample of 65 weekly reports showed a sample mean of 19.5 customer contacts per week. The sample standard deviation was 5.2. Provide 90% and 95% confidence intervals for the population mean number of weekly customer contacts for the sales personnel. 90% Confidence interval, to 2 decimals: ( , ) 95% Confidence interval, to 2 decimals:arrow_forwardA simple random sample of 40 items resulted in a sample mean of 25. The population standard deviation is 5. a. What is the standard error of the mean (to 2 decimals)? b. At 95% confidence, what is the margin of error (to 2 decimals)?arrow_forward
- mean trough level of the population to be 3.7 micrograms/mL. The researcher conducts a study among 93 newly diagnosed arthritis patients and finds the mean trough to be 4.1 micrograms/mL with a standard deviation of 2.4 micrograms/mL. The researcher wants to test at the 5% level of significance if the trough is different than previously reported or not. Z statistics will be used. Complete Step 5 of hypothesis testing: Conclusion. State whether or not you would reject the null hypothesis and why. Also interpret what this means (i.e. is the mean trough different from 3.7 or noarrow_forward30% of all college students major in STEM (Science, Technology, Engineering, and Math). If 48 college students are randomly selected, find the probability thata. Exactly 12 of them major in STEM. b. At most 17 of them major in STEM. c. At least 12 of them major in STEM. d. Between 9 and 13 (including 9 and 13) of them major in STEM.arrow_forward7% of all Americans live in poverty. If 40 Americans are randomly selected, find the probability thata. Exactly 4 of them live in poverty. b. At most 1 of them live in poverty. c. At least 1 of them live in poverty. d. Between 2 and 9 (including 2 and 9) of them live in poverty.arrow_forward
- 48% of all violent felons in the prison system are repeat offenders. If 40 violent felons are randomly selected, find the probability that a. Exactly 18 of them are repeat offenders. b. At most 18 of them are repeat offenders. c. At least 18 of them are repeat offenders. d. Between 17 and 21 (including 17 and 21) of them are repeat offenders.arrow_forwardConsider an MA(6) model with θ1 = 0.5, θ2 = −25, θ3 = 0.125, θ4 = −0.0625, θ5 = 0.03125, and θ6 = −0.015625. Find a much simpler model that has nearly the same ψ-weights.arrow_forwardLet {Yt} be an AR(2) process of the special form Yt = φ2Yt − 2 + et. Use first principles to find the range of values of φ2 for which the process is stationary.arrow_forward
 MATLAB: An Introduction with ApplicationsStatisticsISBN:9781119256830Author:Amos GilatPublisher:John Wiley & Sons Inc
 Probability and Statistics for Engineering and th...StatisticsISBN:9781305251809Author:Jay L. DevorePublisher:Cengage Learning
 Statistics for The Behavioral Sciences (MindTap C...StatisticsISBN:9781305504912Author:Frederick J Gravetter, Larry B. WallnauPublisher:Cengage Learning
 Elementary Statistics: Picturing the World (7th E...StatisticsISBN:9780134683416Author:Ron Larson, Betsy FarberPublisher:PEARSON
 The Basic Practice of StatisticsStatisticsISBN:9781319042578Author:David S. Moore, William I. Notz, Michael A. FlignerPublisher:W. H. Freeman
 Introduction to the Practice of StatisticsStatisticsISBN:9781319013387Author:David S. Moore, George P. McCabe, Bruce A. CraigPublisher:W. H. Freeman