
Concept explainers
Videos
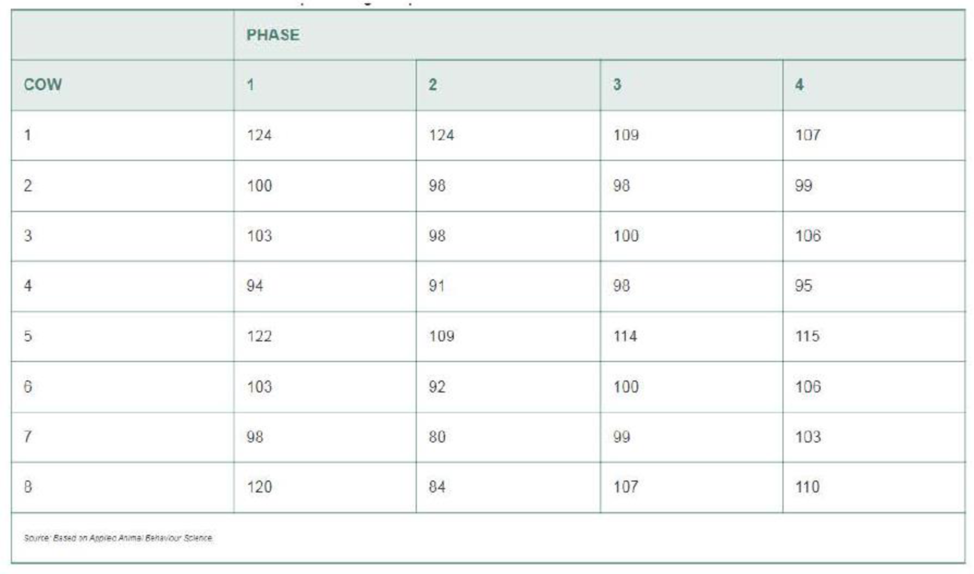
Stress in cows prior to slaughter. What is the level of stress (if any) that cows undergo prior to being slaughtered? To answer this question, researchers designed an experiment involving cows bred in Normandy. France (Applied Animal Behaviour Science, June 2010). The heart rate (beats per minute) of a cow was measured at four different pre-slaughter phases—(1) first phase of visual contact with pen mates. (2) initial isolation from pen mates for prepping, (3) restoration of visual contact with pen mates, and (4) first contact with human prior to slaughter. Data for eight cows (simulated from information provided in the article) are shown in the accompanying table. The researchers analyzed the data using an analysis of variance for a randomized block design. Their objective was to determine whether the mean heart rate of cows differed in the four pre-slaughter phases.
- a. Identify the treatments and blocks for this experimental design.
- b. Conduct the appropriate analysis using a statistical software package. Summarize the results in an ANOVA table.
- c. Is there evidence of differences among the mean heart rates of cows in the four pre-slaughter phases? Test using α = .05.
- d. If warranted, conduct a multiple comparisons procedure to rank the four treatment means. Use an experimentwise error rate of α = .05.
Want to see the full answer?
Check out a sample textbook solution
Chapter 9 Solutions
MyLab Statistics for Business Stats with Pearson eText -- Standalone Access Card -- for Statistics for Business and Economics


- If GDP goes up by 1% and the investment component of GDPgoes up by more than 1%, how is the investment share ofGDP changing in absolute terms?▶ In economics, what else is expressed as relative percentagechanges?arrow_forwardCEO Salary and Firm SalesWe can estimate a constant elasticity model relating CEO salary to firm sales. The data set is the same one used in Example 2.3, except we now relate salary to sales. Let sales be annual firm sales, measured in millions of dollars. A constant elasticity model is[2.45]ßßlog (salary) = ß0 + ß0log (sales) + u,where ß1 is the elasticity of salary with respect to sales. This model falls under the simple regression model by defining the dependent variable to be y = log(salary) and the independent variable to be x = log1sales2. Estimating this equation by OLS gives[2.46]log (salary)^=4.822 + 0.257 (sales) n = 209, R2 = 0.211.The coefficient of log(sales) is the estimated elasticity of salary with respect to sales. It implies that a 1% increase in firm sales increases CEO salary by about 0.257%—the usual interpretation of an elasticity.arrow_forwardSolvearrow_forward
- B G C D E H M K Armchair For puzzles 96 and 97, use the first phylogenetic tree on the following page (Figure 2). 96) Who is the most recent common ancestor of species A and species G? 97) Who is the most recent common ancestor of species D, E, and F?arrow_forwardNot use ai pleasearrow_forwardNot use ai pleasearrow_forward
- Stealth bank has deposits of $700 million. It holds reserves of $20 million and has purchased government bonds worth $350 million. The banks loans, if sold at current market value, would be worth $600 million. What is the total value of Stealth bank's assets? I believe my calculation of 1.3 billion may be incorrect May I have my work checked pleasearrow_forwardThe following graph shows the downward-sloping demand curve for Oiram-46, a monopolist producing unique magic hats. The graph also shows Oiram-46's marginal revenue curve and its average total cost curve. On the following graph, use the orange point (square symbol) to indicate the profit-maximizing quantity. Use the blue point (circle symbol) to indicate the profit-maximizing price. Use the purple point (diamond symbol) to indicate the average total cost. Use the tan rectangle (dash symbol) to show Oiram-46's total revenue and the grey rectangle (star symbol) to show its total cost. PRICE (Dollars per magic hat) 2 0 20 Marginal Cost 18 ATC 16 Profit-Maximizing Quantity 14 12 Profit-Maximizing Price MC 8 Demand 02 4 6 8 10 12 14 16 18 20 QUANTITY (Magic hats per week) Based on the graph, Oiram-46's profit is equal to 5 TOTAL SCORE: 1/4 Average Total Cost Total Revenue Total Cost Grade Step 2 (to complete this step and unlock the next step)arrow_forwardExplain information regarding the effective interest rates being charged and how much higher the rent-to-own stores’ cash price exceeded the price of the identical item at a reputable retail outlet.arrow_forward

 Managerial Economics: A Problem Solving ApproachEconomicsISBN:9781337106665Author:Luke M. Froeb, Brian T. McCann, Michael R. Ward, Mike ShorPublisher:Cengage Learning
 Managerial Economics: Applications, Strategies an...EconomicsISBN:9781305506381Author:James R. McGuigan, R. Charles Moyer, Frederick H.deB. HarrisPublisher:Cengage Learning

