
Videos
a.
Find the p-value and state the conclusion.
a.
Answer to Problem 26E
The p-value is 0.039.
The conclusion is “reject the null hypothesis”.
Explanation of Solution
Calculation:
The given information is the
The hypotheses are given below:
Null hypothesis:
Alternative hypothesis:
Test statistic:
The formula for finding test statistic is as follows:
Here,
Substitute
Thus, the value of the test statistic is 2.10.
The degrees of freedom is,
Software Procedure:
Step-by-step procedure to obtain the probability value using Excel:
- Open an EXCEL sheet and select the cell A1.
- Enter the formula =T.DIST.2T(2.10,64) in the cell A1.
- Press Enter.
Output using the EXCEL software is given below:
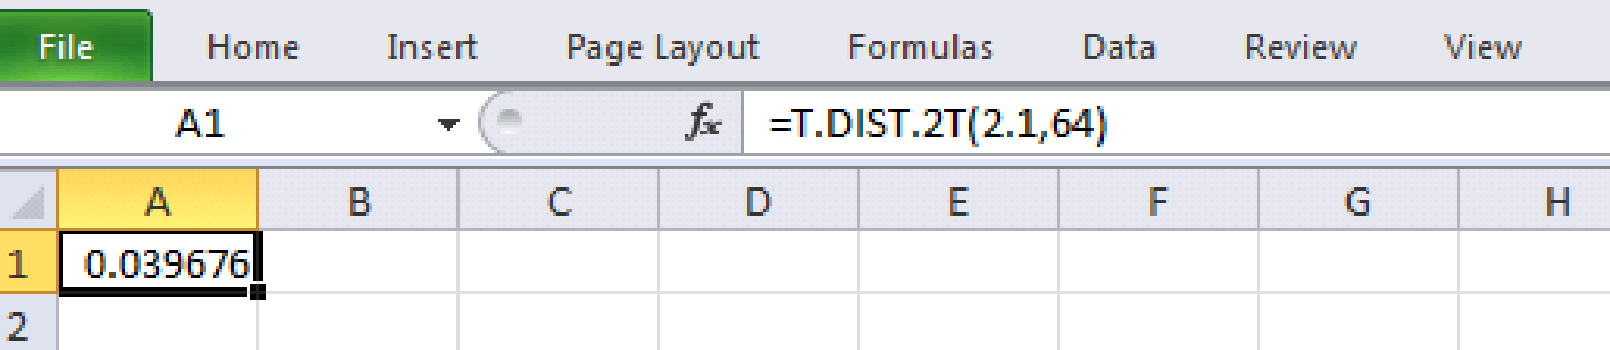
From the output, the exact p-value is approximately 0.040.
Rejection rule:
If
If
Conclusion:
Here, the p-value is less than the level of significance.
That is,
By the rejection rule, the null hypothesis is rejected.
b.
Calculate the p-value and draw the conclusion.
b.
Answer to Problem 26E
The p-value is 0.013.
The conclusion is “reject the null hypothesis”.
Explanation of Solution
Calculation:
The given information is that the sample size is
Test statistic:
Substitute
Thus, the value of the test statistic is –2.57.
From part (a), the degrees of freedom is 64.
Software Procedure:
Step-by-step procedure to obtain the probability value using Excel:
- Open an EXCEL sheet and select the cell A1.
- Enter the formula =T.DIST.2T(2.57,64) in the cell A1.
- Press Enter.
Output using the EXCEL software is given below:
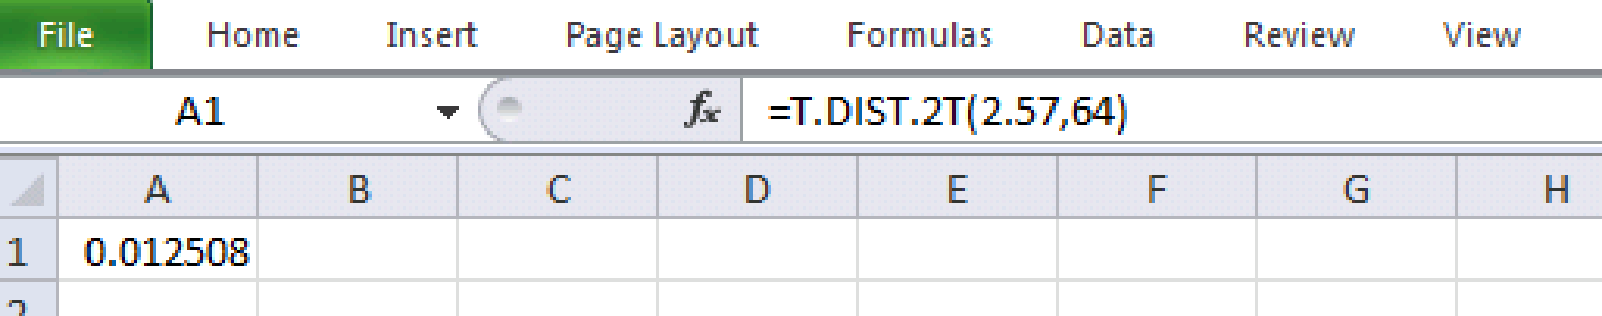
From the output, the exact p-value is approximately 0.0125.
Conclusion:
Here, the p-value is less than the level of significance.
That is,
By the rejection rule, the null hypothesis is rejected.
c.
Obtain the p-value and claim the conclusion.
c.
Answer to Problem 26E
The p-value is 0.130.
The conclusion is “do not reject the null hypothesis”.
Explanation of Solution
Calculation:
The given information is that the sample size is
Test statistic:
Substitute
Thus, the value of the test statistic is 1.54.
From part (a), the degrees of freedom is 64.
Software Procedure:
Step-by-step procedure to obtain the probability value using Excel:
- Open an EXCEL sheet and select the cell A1.
- Enter the formula =T.DIST.2T(1.54,64) in the cell A1.
- Press Enter.
Output using the EXCEL software is given below:
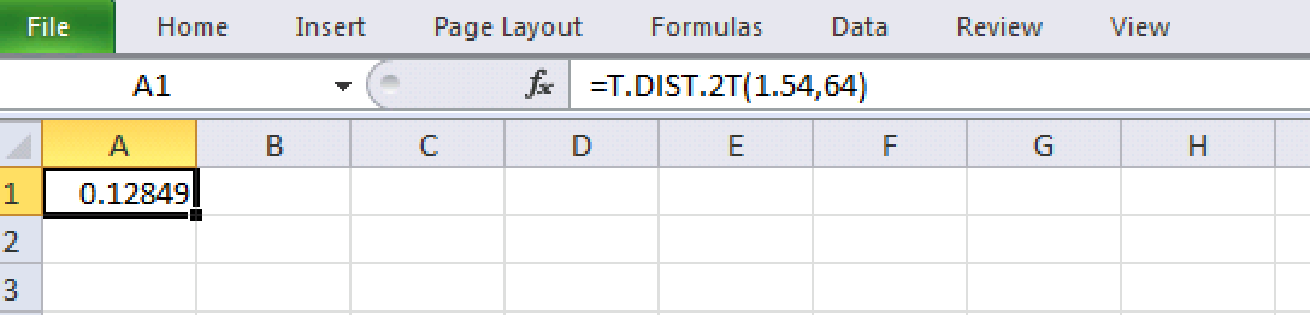
From the output, the exact p-value is approximately 0.01285.
Conclusion:
Here, the p-value is greater than the level of significance.
That is,
By the rejection rule, the null hypothesis is not rejected.
Want to see more full solutions like this?
Chapter 9 Solutions
Bundle: Modern Business Statistics with Microsoft Office Excel, Loose-Leaf Version, 6th + MindTap Business Statistics, 2 terms (12 months) Printed Access Card


- 9. The concentration function of a random variable X is defined as Qx(h) = sup P(x ≤ X ≤x+h), h>0. Show that, if X and Y are independent random variables, then Qx+y (h) min{Qx(h). Qr (h)).arrow_forward10. Prove that, if (t)=1+0(12) as asf->> O is a characteristic function, then p = 1.arrow_forward9. The concentration function of a random variable X is defined as Qx(h) sup P(x ≤x≤x+h), h>0. (b) Is it true that Qx(ah) =aQx (h)?arrow_forward
- 3. Let X1, X2,..., X, be independent, Exp(1)-distributed random variables, and set V₁₁ = max Xk and W₁ = X₁+x+x+ Isk≤narrow_forward7. Consider the function (t)=(1+|t|)e, ER. (a) Prove that is a characteristic function. (b) Prove that the corresponding distribution is absolutely continuous. (c) Prove, departing from itself, that the distribution has finite mean and variance. (d) Prove, without computation, that the mean equals 0. (e) Compute the density.arrow_forward1. Show, by using characteristic, or moment generating functions, that if fx(x) = ½ex, -∞0 < x < ∞, then XY₁ - Y2, where Y₁ and Y2 are independent, exponentially distributed random variables.arrow_forward
- 1. Show, by using characteristic, or moment generating functions, that if 1 fx(x): x) = ½exarrow_forward1990) 02-02 50% mesob berceus +7 What's the probability of getting more than 1 head on 10 flips of a fair coin?arrow_forward9. The concentration function of a random variable X is defined as Qx(h) sup P(x≤x≤x+h), h>0. = x (a) Show that Qx+b(h) = Qx(h).arrow_forward
- Suppose that you buy a lottery ticket, and you have to pick six numbers from 1 through 50 (repetitions allowed). Which combination is more likely to win: 13, 48, 17, 22, 6, 39 or 1, 2, 3, 4, 5, 6? barrow_forward2 Make a histogram from this data set of test scores: 72, 79, 81, 80, 63, 62, 89, 99, 50, 78, 87, 97, 55, 69, 97, 87, 88, 99, 76, 78, 65, 77, 88, 90, and 81. Would a pie chart be appropriate for this data? ganizing Quantitative Data: Charts and Graphs 45arrow_forward10 Meteorologists use computer models to predict when and where a hurricane will hit shore. Suppose they predict that hurricane Stat has a 20 percent chance of hitting the East Coast. a. On what info are the meteorologists basing this prediction? b. Why is this prediction harder to make than your chance of getting a head on your next coin toss? U anoiaarrow_forward
 Glencoe Algebra 1, Student Edition, 9780079039897...AlgebraISBN:9780079039897Author:CarterPublisher:McGraw Hill
 Big Ideas Math A Bridge To Success Algebra 1: Stu...AlgebraISBN:9781680331141Author:HOUGHTON MIFFLIN HARCOURTPublisher:Houghton Mifflin Harcourt