
Videos
Antipsychotic drugs are widely prescribed for conditions such as schizophrenia and bipolar disease. The article “Cardiometabolic Risk of Second- Generation Antipsychotic Medications During First-Time Use in Children and Adolescents” (J. of the Amer. Med. Assoc., 2009) reported on body composition and metabolic changes for individuals who had taken various antipsychotic drugs for short periods of time.
a. The sample of 41 individuals who had taken aripiprazole had a
b. The article also reported that for a sample of 36 individuals who had taken quetiapine, the sample mean cholesterol level change and estimated standard error were 9.05 and 4.256, respectively. Making any necessary assumptions about the distribution of change in cholesterol level, does the choice of significance level impact your conclusion as to whether true average cholesterol level increases? Explain. [Note: The article included a P-value.] c. For the sample of 45 individuals who had taken olanzapine, the article reported (7.38, 9.69) as a 95% CI for true average weight gain (kg). What is a 99% CI?
a.
Calculate the 95% confidence interval for the true average increase in total cholesterol.
Answer to Problem 41E
The 95% confidence interval for the true average increase in total cholesterol lies between –3.85 and 11.35.
Explanation of Solution
Given info:
The information is based on selecting a sample of 41 individuals has been taken antipsychotic drugs for the short period of time has the mean of 3.75 and the estimated standard error of 3.878.
Calculation:
Let
Confidence interval:
The confidence interval using large sample method is,
Where
Confidence interval:
Step-by-step procedure to obtain the confidence interval using the MINITAB software:
- Choose Stat > Basic Statistics > One sample Z.
- Choose Summarized columns. Enter the Sample size as 41, Mean as 3.78 and Standard deviation as 24.8.
- In Perform hypothesis test, enter the 0.
- Choose Options.
- In Confidence level, enter 95.
- In Alternative, select Not equal.
- Click OK in all the dialog boxes.
Output using the MINITAB software is given below:
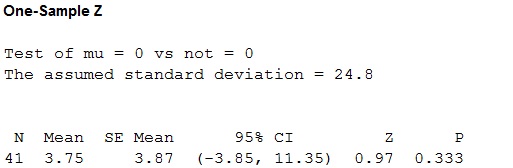
From the MINITAB output, the confidence interval is (–3.85,11.35).
Thus, the 95% confidence interval for the true average increase in total cholesterol lies between –3.85 and 11.35.
Interpretation:
There is 95% confident that the true average increase in total cholesterol lies between –3.85 and 11.35.
b.
Explain whether the choice of significance level impact the conclusion that the true average cholesterol level under the quetiapine is positive.
Answer to Problem 41E
The data provides the sufficient evidence that the true average cholesterol level under the quetiapine is positive at the level of significance of 5%.
Explanation of Solution
Given info:
The information is based on selecting a sample of 36 individuals has been taken quetiapine drugs for the short period of time has the mean of 9.05 and the estimated standard error of 4.256.
Calculation:
Let
Assume that the level of significance is 0.05.
The test hypotheses are,
Null hypothesis:
That is, the true mean change in the total cholesterol under quetiapine is same.
Alternative hypothesis:
That is, the true mean change in the total cholesterol quetiapine is positive.
Requirements for a paired t-test:
- The sample X and Y taken from the population is selected at random.
- The samples X and Y are dependent of each other.
- Samples must be distributed to normal.
Here, the samples selected at random and dependent. Moreover, the sample size is assumed to be normally distributed. Hence, the assumptions are satisfied.
Test statistic:
The test statistic is,
Where
The test statistic is obtained given below:
Substitute
The test statistic is 2.13
The P- value is obtained by
As there are 36 individuals , thus
Thus,
Rejection region:
If
If
Conclusion:
Here, the P-value is less than the level of significance.
That is,
Therefore, the decision is “reject the null hypothesis”.
Thus, there is enough evidence to infer that the true average cholesterol level under the quetiapine is positive at the level of significance of 5%.
c.
Find the 99% confidence interval for the true average weight gain.
Answer to Problem 41E
The 99% confidence interval for the true average weight gain is (7.02,10.06)
Explanation of Solution
Given info:
The information is based on selecting a sample of 45 individuals has been taken olanzapine has the 95% confidence interval of (7.38,9.69).
Calculation:
Confidence interval:
The confidence interval using large sample method is,
Where
The sample mean
The standard error of
Level of significance:
The level of significance for both-tailed test,
The 99% confidence interval for the true average weight gain is obtained as:
Substitute
Thus, there is 99% confidence that the true average weight gain lies between the interval 7.02 and 10.06.
Want to see more full solutions like this?
Chapter 9 Solutions
Probability and Statistics for Engineering and the Sciences STAT 400 - University Of Maryland


- 9. The concentration function of a random variable X is defined as Qx(h) = sup P(x ≤ X ≤x+h), h>0. Show that, if X and Y are independent random variables, then Qx+y (h) min{Qx(h). Qr (h)).arrow_forward10. Prove that, if (t)=1+0(12) as asf->> O is a characteristic function, then p = 1.arrow_forward9. The concentration function of a random variable X is defined as Qx(h) sup P(x ≤x≤x+h), h>0. (b) Is it true that Qx(ah) =aQx (h)?arrow_forward
- 3. Let X1, X2,..., X, be independent, Exp(1)-distributed random variables, and set V₁₁ = max Xk and W₁ = X₁+x+x+ Isk≤narrow_forward7. Consider the function (t)=(1+|t|)e, ER. (a) Prove that is a characteristic function. (b) Prove that the corresponding distribution is absolutely continuous. (c) Prove, departing from itself, that the distribution has finite mean and variance. (d) Prove, without computation, that the mean equals 0. (e) Compute the density.arrow_forward1. Show, by using characteristic, or moment generating functions, that if fx(x) = ½ex, -∞0 < x < ∞, then XY₁ - Y2, where Y₁ and Y2 are independent, exponentially distributed random variables.arrow_forward
- 1. Show, by using characteristic, or moment generating functions, that if 1 fx(x): x) = ½exarrow_forward1990) 02-02 50% mesob berceus +7 What's the probability of getting more than 1 head on 10 flips of a fair coin?arrow_forward9. The concentration function of a random variable X is defined as Qx(h) sup P(x≤x≤x+h), h>0. = x (a) Show that Qx+b(h) = Qx(h).arrow_forward
- Suppose that you buy a lottery ticket, and you have to pick six numbers from 1 through 50 (repetitions allowed). Which combination is more likely to win: 13, 48, 17, 22, 6, 39 or 1, 2, 3, 4, 5, 6? barrow_forward2 Make a histogram from this data set of test scores: 72, 79, 81, 80, 63, 62, 89, 99, 50, 78, 87, 97, 55, 69, 97, 87, 88, 99, 76, 78, 65, 77, 88, 90, and 81. Would a pie chart be appropriate for this data? ganizing Quantitative Data: Charts and Graphs 45arrow_forward10 Meteorologists use computer models to predict when and where a hurricane will hit shore. Suppose they predict that hurricane Stat has a 20 percent chance of hitting the East Coast. a. On what info are the meteorologists basing this prediction? b. Why is this prediction harder to make than your chance of getting a head on your next coin toss? U anoiaarrow_forward
 Glencoe Algebra 1, Student Edition, 9780079039897...AlgebraISBN:9780079039897Author:CarterPublisher:McGraw Hill
 Holt Mcdougal Larson Pre-algebra: Student Edition...AlgebraISBN:9780547587776Author:HOLT MCDOUGALPublisher:HOLT MCDOUGAL
 Big Ideas Math A Bridge To Success Algebra 1: Stu...AlgebraISBN:9781680331141Author:HOUGHTON MIFFLIN HARCOURTPublisher:Houghton Mifflin Harcourt
 Functions and Change: A Modeling Approach to Coll...AlgebraISBN:9781337111348Author:Bruce Crauder, Benny Evans, Alan NoellPublisher:Cengage Learning