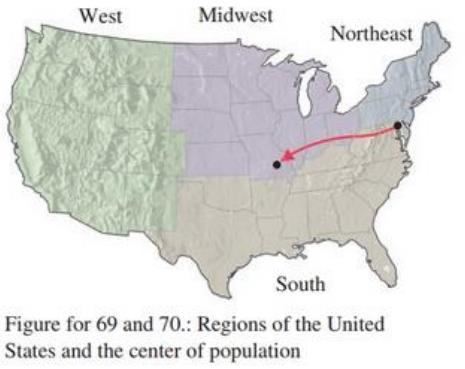
The population center of the

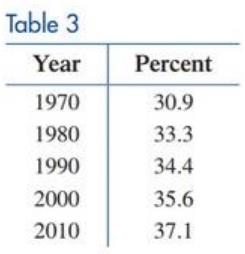
Population shifts. Table 3 gives the percentage of the U.S. population living in the south region during the indicated years.

The following transition matrix
(A) Let
(B) Construct a new table comparing the results from part (A) with the data in Table 3.
(C) According to this transition matrix, what percentage of the population will live in the south region in the long run?
Want to see the full answer?
Check out a sample textbook solution
Chapter 9 Solutions
Finite Mathematics for Business, Economics, Life Sciences and Social Sciences Plus NEW MyLab Math with Pearson eText -- Access Card Package (13th Edition)
Additional Math Textbook Solutions
Introductory Statistics
Algebra and Trigonometry (6th Edition)
Elementary Statistics (13th Edition)
Calculus: Early Transcendentals (2nd Edition)
College Algebra (7th Edition)
A First Course in Probability (10th Edition)
- 4. 5. 6. Prove that p (gp) is a tautology using the laws of propositional logic. Prove that p((pVq) → q) is a tautology using the laws of propositional logic. Let us say a natural number n is ok if there are two natural numbers whose sum is n and whose product is n. (Convention: the natural numbers consist of 0, 1, 2,...) (a) Give a logical expression that means "n is ok". (b) Show that 0 and 4 are both ok. (c) Give a logical expression that means "every natural number is ok". (d) Give a logical expression that means "it is not the case that every number is ok". Push the negations into the expression as far as possible.arrow_forward7. Let E(x, y) be a two-variable predicate meaning "x likes to eat y", where the domain of x is people and the domain of y is foods. Write logical expressions that represent the following English propositions: (a) Alice doesn't like to eat pizza. (b) Everybody likes to eat at least one food. (c) Every student likes to eat at least one food other than pizza. (d) Everyone other than Alice likes to eat at least two different foods. (e) There are two different people that like to eat the same food.arrow_forward21. Determine for which values of m the function (x) = x™ is a solution to the given equation. a. 3x2 d²y dx² b. x2 d²y +11x dy - 3y = 0 dx dy dx2 x dx 5y = 0arrow_forward
- Question Find the following limit. Select the correct answer below: 1 2 0 4 5x lim sin (2x)+tan 2 x→arrow_forwardA quality characteristic of a product is normally distributed with mean μ and standard deviation σ = 1. Speci- fications on the characteristic are 6≤x≤8. A unit that falls within specifications on this quality characteristic results in a profit of Co. However, if x 8, the profit is -C2. Find the value ofμ that maximizes the expected profit.arrow_forwardA) The output voltage of a power supply is normally distributed with mean 5 V and standard deviation 0.02 V. If the lower and upper specifications for voltage are 4.95 V and 5.05 V, respectively, what is the probability that a power supply selected at random conform to the specifications on voltage? B) Continuation of A. Reconsider the power supply manufacturing process in A. Suppose We wanted to improve the process. Can shifting the mean reduce the number of nonconforming units produced? How much would the process variability need to be reduced in order to have all but one out of 1000 units conform to the specifications?arrow_forward
- A mechatronic assembly is subjected to a final functional test. Suppose that defects occur at random in these assemblies, and that defects occur according to a Poisson distribution with parameter >= 0.02. (a) What is the probability that an assembly will have exactly one defect? (b) What is the probability that an assembly will have one or more defects? (c) Suppose that you improve the process so that the occurrence rate of defects is cut in half to λ = 0.01. What effect does this have on the probability that an assembly will have one or more defects?arrow_forwardShow all steps. Correct answer is 1/2sec(theta) +Ccos(theta)arrow_forwardA random sample of 50 units is drawn from a production process every half hour. The fraction of non-conforming product manufactured is 0.02. What is the probability that p < 0.04 if the fraction non-conforming really is 0.02?arrow_forward
 Algebra: Structure And Method, Book 1AlgebraISBN:9780395977224Author:Richard G. Brown, Mary P. Dolciani, Robert H. Sorgenfrey, William L. ColePublisher:McDougal Littell
 Glencoe Algebra 1, Student Edition, 9780079039897...AlgebraISBN:9780079039897Author:CarterPublisher:McGraw Hill
 Mathematics For Machine TechnologyAdvanced MathISBN:9781337798310Author:Peterson, John.Publisher:Cengage Learning,
 Holt Mcdougal Larson Pre-algebra: Student Edition...AlgebraISBN:9780547587776Author:HOLT MCDOUGALPublisher:HOLT MCDOUGAL


