Elementary Statistics Books a la carte Plus NEW MyLab Statistics with Pearson eText - Access Card Package (6th Edition)
6th Edition
ISBN: 9780133876239
Author: Ron Larson, Betsy Farber
Publisher: PEARSON
bartleby

Concept explainers

bartleby

Videos

Textbook Question
Book Icon
Chapter 9.2, Problem 25E

Finding the Equation of a Regression Line In Exercises 17–26, find the equation of the regression line for the data. Then construct a scatter plot of the data and draw the regression line. (Each pair of variables has a significant correlation.) Then use the regression equation to predict the value of y for each of the x-values, if meaningful. If the x-value is not meaningful to predict the value of y, explain why not. If convenient, use technology.

25. Shoe Size and Height The shoe sizes and heights (in inches) of 14 men
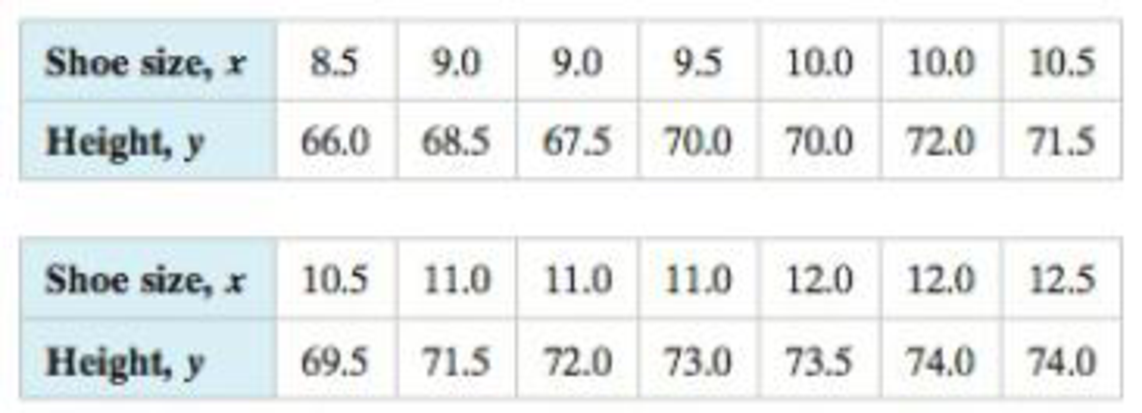
Chapter 9.2, Problem 25E, Finding the Equation of a Regression Line In Exercises 1726, find the equation of the regression

(a) x = size 11.5

(b) x = size 8.0

(c) x = size 15.5

(d) x = size 10.0

Blurred answer
Students have asked these similar questions
Question 2 A nickel-titanium alloy is used to make components for jet turbine aircraft engines. Cracking is a potentially serious problem in the final part because it can lead to nonrecoverable failure. A test is run at the parts producer to determine the effect of four factors on cracks. The four factors are: pouring temperature (A), titanium content (B), heat treatment method (C), amount of grain refiner used (D). Two replicates of a 24 design are run, and the length of crack (in mm x10-2) induced in a sample coupon subjected to a standard test is measured. The data are shown in Table 2. 1 (a) Estimate the factor effects. Which factor effects appear to be large? (b) Conduct an analysis of variance. Do any of the factors affect cracking? Use a = 0.05. (c) Write down a regression model that can be used to predict crack length as a function of the significant main effects and interactions you have identified in part (b). (d) Analyze the residuals from this experiment. (e) Is there an…
A 24-1 design has been used to investigate the effect of four factors on the resistivity of a silicon wafer. The data from this experiment are shown in Table 4. Table 4: Resistivity Experiment for Exercise 5 Run A B с D Resistivity 1 23 2 3 4 5 6 7 8 9 10 11 12 I+I+I+I+Oooo 0 0 ||++TI++o000 33.2 4.6 31.2 9.6 40.6 162.4 39.4 158.6 63.4 62.6 58.7 0 0 60.9 3 (a) Estimate the factor effects. Plot the effect estimates on a normal probability scale. (b) Identify a tentative model for this process. Fit the model and test for curvature. (c) Plot the residuals from the model in part (b) versus the predicted resistivity. Is there any indication on this plot of model inadequacy? (d) Construct a normal probability plot of the residuals. Is there any reason to doubt the validity of the normality assumption?
Stem1: 1,4 Stem 2: 2,4,8 Stem3: 2,4 Stem4: 0,1,6,8 Stem5: 0,1,2,3,9 Stem 6: 2,2 What’s the Min,Q1, Med,Q3,Max?

Chapter 9 Solutions

Elementary Statistics Books a la carte Plus NEW MyLab Statistics with Pearson eText - Access Card Package (6th Edition)

Ch. 9.1 - What does the sample correlation coefficient r...Ch. 9.1 - Give examples of two variables that have perfect...Ch. 9.1 - Explain how to determine whether a sample...Ch. 9.1 - Discuss the difference between r and p.Ch. 9.1 - Prob. 8ECh. 9.1 - Graphical Analysis In Exercises 912, determine...Ch. 9.1 - Graphical Analysis In Exercises 912, determine...Ch. 9.1 - Prob. 11ECh. 9.1 - Graphical Analysis In Exercises 912, determine...Ch. 9.1 - Prob. 13ECh. 9.1 - Graphical Analysis In Exercises 912, determine...Ch. 9.1 - Graphical Analysis In Exercises 1518, the scatter...Ch. 9.1 - Graphical Analysis In Exercises 1518, the scatter...Ch. 9.1 - Graphical Analysis In Exercises 1518, the scatter...Ch. 9.1 - Graphical Analysis In Exercises 1518, the scatter...Ch. 9.1 - In Exercises 13 and 14, identify the explanatory...Ch. 9.1 - In Exercises 13 and 14, identify the explanatory...Ch. 9.1 - Prob. 21ECh. 9.1 - Prob. 22ECh. 9.1 - Constructing a Scatter Plot and Determining...Ch. 9.1 - Constructing a Scatter Plot and Determining...Ch. 9.1 - Prob. 25ECh. 9.1 - Constructing a Scatter Plot and Determining...Ch. 9.1 - Prob. 27ECh. 9.1 - Prob. 28ECh. 9.1 - Prob. 29ECh. 9.1 - Prob. 30ECh. 9.1 - The t-Test for Correlation Coefficients In...Ch. 9.1 - The t-Test for Correlation Coefficients In...Ch. 9.1 - Prob. 34ECh. 9.1 - Prob. 33ECh. 9.1 - Interchanging x and y In Exercise 26, let the time...Ch. 9.1 - Generate a new data set. Using your knowledge of...Ch. 9.1 - Describe how to create a data set with a value of...Ch. 9.1 - Describe how to create a data set with a value of...Ch. 9.1 - Try to create a data set with a value of r that is...Ch. 9.2 - Prob. 1TYCh. 9.2 - Prob. 2TYCh. 9.2 - Prob. 3TYCh. 9.2 - What is a residual? Explain when a residual is...Ch. 9.2 - Two variables have a positive linear correlation....Ch. 9.2 - Explain how to predict y-values using the equation...Ch. 9.2 - For a set of data and a corresponding regression...Ch. 9.2 - In order to predict y-values using the equation of...Ch. 9.2 - Why is it not appropriate to use a regression line...Ch. 9.2 - In Exercises 712, match the description in the...Ch. 9.2 - In Exercises 712, match the description in the...Ch. 9.2 - In Exercises 712, match the description in the...Ch. 9.2 - In Exercises 712, match the description in the...Ch. 9.2 - In Exercises 712, match the description in the...Ch. 9.2 - In Exercises 712, match the description in the...Ch. 9.2 - Prob. 13ECh. 9.2 - Prob. 14ECh. 9.2 - Prob. 15ECh. 9.2 - Prob. 16ECh. 9.2 - Prob. 17ECh. 9.2 - Prob. 18ECh. 9.2 - Finding the Equation of a Regression Line In...Ch. 9.2 - Prob. 20ECh. 9.2 - Finding the Equation of a Regression Line In...Ch. 9.2 - Finding the Equation of a Regression Line In...Ch. 9.2 - Prob. 23ECh. 9.2 - Prob. 24ECh. 9.2 - Finding the Equation of a Regression Line In...Ch. 9.2 - Finding the Equation of a Regression Line In...Ch. 9.2 - Prob. 27ECh. 9.2 - Prob. 28ECh. 9.2 - Prob. 29ECh. 9.2 - Prob. 30ECh. 9.2 - Interchanging X and y In Exercises 31 and 32,...Ch. 9.2 - Interchanging X and y In Exercises 31 and 32,...Ch. 9.2 - In Exercises 33 and 34, (a) find the equation of...Ch. 9.2 - In Exercises 33 and 34, (a) find the equation of...Ch. 9.2 - In Exercises 35 and 36, (a) construct a scatter...Ch. 9.2 - Prob. 36ECh. 9.2 - Prob. 37ECh. 9.2 - Prob. 38ECh. 9.2 - Prob. 39ECh. 9.2 - Prob. 40ECh. 9.2 - Prob. 41ECh. 9.2 - Prob. 42ECh. 9.2 - Prob. 43ECh. 9.2 - Prob. 44ECh. 9.2 - Prob. 45ECh. 9.2 - Prob. 46ECh. 9.2 - Prob. 47ECh. 9.2 - Prob. 48ECh. 9.2 - Prob. 1ACh. 9.2 - Prob. 2ACh. 9.2 - Prob. 3ACh. 9.2 - Prob. 4ACh. 9.2 - Prob. 1CSCh. 9.2 - Prob. 2CSCh. 9.2 - Prob. 3CSCh. 9.2 - Prob. 4CSCh. 9.2 - Prob. 5CSCh. 9.3 - Prob. 1TYCh. 9.3 - Prob. 2TYCh. 9.3 - Prob. 3TYCh. 9.3 - Graphical Analysis In Exercises 13, use the...Ch. 9.3 - Graphical Analysis In Exercises 13, use the...Ch. 9.3 - Graphical Analysis In Exercises 13, use the...Ch. 9.3 - The coefficient of determination r2 is the ratio...Ch. 9.3 - What is the coefficient of determination for two...Ch. 9.3 - Two variables have a bivariate normal...Ch. 9.3 - In Exercises 710, use the value of the correlation...Ch. 9.3 - In Exercises 710, use the value of the correlation...Ch. 9.3 - In Exercises 710, use the value of the correlation...Ch. 9.3 - In Exercises 710, use the value of the correlation...Ch. 9.3 - Finding the Coefficient of Determination and the...Ch. 9.3 - Prob. 12ECh. 9.3 - Prob. 13ECh. 9.3 - Finding the Coefficient of Determination and the...Ch. 9.3 - Prob. 15ECh. 9.3 - Prob. 16ECh. 9.3 - Prob. 17ECh. 9.3 - Prob. 18ECh. 9.3 - Prob. 19ECh. 9.3 - Prob. 20ECh. 9.3 - Constructing and Interpreting a Prediction...Ch. 9.3 - Prob. 22ECh. 9.3 - Prob. 23ECh. 9.3 - Constructing and Interpreting a Prediction...Ch. 9.3 - Prob. 25ECh. 9.3 - Prob. 26ECh. 9.3 - Prob. 27ECh. 9.3 - Prob. 28ECh. 9.3 - Prob. 29ECh. 9.3 - Prob. 30ECh. 9.3 - Prob. 31ECh. 9.3 - Prob. 32ECh. 9.3 - Prob. 33ECh. 9.3 - Prob. 34ECh. 9.3 - Prob. 35ECh. 9.3 - Prob. 36ECh. 9.3 - Prob. 37ECh. 9.3 - In Exercises 37 and 38, construct the indicated...Ch. 9.4 - Prob. 1TYCh. 9.4 - Prob. 2TYCh. 9.4 - Predicting y-Values In Exercises 14, use the...Ch. 9.4 - Predicting y-Values In Exercises 14, use the...Ch. 9.4 - Prob. 3ECh. 9.4 - Predicting y-Values In Exercises 14, use the...Ch. 9.4 - Prob. 5ECh. 9.4 - Prob. 6ECh. 9.4 - Prob. 7ECh. 9.4 - Prob. 8ECh. 9 - Prob. 2UACh. 9 - Prob. 9.1.1RECh. 9 - Prob. 9.1.2RECh. 9 - In Exercises 14, (a) display the data in a scatter...Ch. 9 - In Exercises 14, (a) display the data in a scatter...Ch. 9 - Prob. 9.1.5RECh. 9 - Prob. 9.1.6RECh. 9 - Prob. 9.1.7RECh. 9 - Prob. 9.1.8RECh. 9 - Prob. 9.2.9RECh. 9 - Prob. 9.2.10RECh. 9 - In Exercises 912, find the equation of the...Ch. 9 - Prob. 9.2.12RECh. 9 - In Exercises 1316, use the value of the...Ch. 9 - Prob. 9.3.14RECh. 9 - Prob. 9.3.15RECh. 9 - Prob. 9.3.16RECh. 9 - Prob. 9.3.17RECh. 9 - Prob. 9.3.18RECh. 9 - Prob. 9.3.19RECh. 9 - Prob. 9.3.20RECh. 9 - Prob. 9.3.21RECh. 9 - In Exercises 1924, construct the indicated...Ch. 9 - Prob. 9.3.23RECh. 9 - Prob. 9.3.24RECh. 9 - Prob. 9.4.25RECh. 9 - Prob. 9.4.26RECh. 9 - Prob. 9.4.27RECh. 9 - Prob. 9.4.28RECh. 9 - Prob. 1CQCh. 9 - Prob. 2CQCh. 9 - Prob. 3CQCh. 9 - Prob. 4CQCh. 9 - Prob. 5CQCh. 9 - Prob. 6CQCh. 9 - Prob. 7CQCh. 9 - Prob. 8CQCh. 9 - Prob. 9CQCh. 9 - Prob. 1CTCh. 9 - Prob. 2CTCh. 9 - Prob. 3CTCh. 9 - Prob. 4CTCh. 9 - Prob. 5CTCh. 9 - Prob. 6CTCh. 9 - Prob. 7CTCh. 9 - Prob. 8CTCh. 9 - Net Sales The equation used to predict the net...Ch. 9 - Prob. 1RSRDCh. 9 - Prob. 2RSRDCh. 9 - Prob. 1TCh. 9 - Prob. 2TCh. 9 - Prob. 3TCh. 9 - Prob. 4TCh. 9 - Prob. 5TCh. 9 - Use technology to find the multiple regression...Ch. 9 - Prob. 7T
Knowledge Booster
Background pattern image
Statistics
Learn more about
Need a deep-dive on the concept behind this application? Look no further. Learn more about this topic, statistics and related others by exploring similar questions and additional content below.
Similar questions
SEE MORE QUESTIONS
Recommended textbooks for you
Text book image
Glencoe Algebra 1, Student Edition, 9780079039897...
Algebra
ISBN:9780079039897
Author:Carter
Publisher:McGraw Hill
Text book image
Functions and Change: A Modeling Approach to Coll...
Algebra
ISBN:9781337111348
Author:Bruce Crauder, Benny Evans, Alan Noell
Publisher:Cengage Learning
Correlation Vs Regression: Difference Between them with definition & Comparison Chart; Author: Key Differences;https://www.youtube.com/watch?v=Ou2QGSJVd0U;License: Standard YouTube License, CC-BY
Correlation and Regression: Concepts with Illustrative examples; Author: LEARN & APPLY : Lean and Six Sigma;https://www.youtube.com/watch?v=xTpHD5WLuoA;License: Standard YouTube License, CC-BY