
Concept explainers
Videos
Please provide the following information for Problems 11-22.
(a) What is the level of significance? State the null and alternate hypotheses.
(b)Check Requirements What sampling distribution will you use? Explain the rationale for your choice of sampling distribution. Compute the appropriate sampling distribution value of the sample test statistic.
(c) Find (or estimate) the P-value. Sketch the sampling distribution and show the area corresponding to the P- value.
(d) Based on your answers in parts (a) to (c), will you reject or fail to reject the null hypothesis? Are the data statistically significant at level ?
(e)Interpret your conclusion in the context of the application.
Note: For degrees of freedom d.f. not given in the Student's t table, use the closest d.f. that is smaller. In some situations, this choice of d.f. may increase the P-value by a small amount and therefore produce a slightly more “conservative" answer.
Archaeology: Tree Rings Tree-ring dating from archaeological excavation sites is used in conjunction with other chronologic evidence to estimate occupation dates of prehistoric Indian ruins in the southwestern United States. It is thought that Burnt Mesa Pueblo was occupied around 1300 A.D. (based on evidence from potsherds and stone tools). The following data give tree-ring dates
| 1189 | 1267 | 1268 | 1275 | 1275 | |
| 1271 | 1272 | 1316 | 1317 | 1230 |
Use a calculator with
ii.Assuming the tree-ring dates in this excavation area follow a distribution that is approximately normal, does this information indicate that the population mean of tree-ring dates in the area is different from (cither higher or lower than) that in 1300
(i)
Whether the sample mean
Answer to Problem 22P
Solution: Yes, the sample mean
Explanation of Solution
To calculate the required statistics using the Minitab, follow the below instructions:
Step 1: Go to the Minitab software.
Step 2: Go to Stat > Basic statistics > Display Descriptive Statistics.
Step 3: Select ‘Tree ring dates’ in variables.
Step 4: Click on OK.
The obtained statistics is:
Descriptive Statistics: Tree ring dates
Statistics
| Variable | N | N* | Mean | SE Mean | StDev | Minimum | Q1 | Median | Q3 | Maximum |
| Tree ring dates | 10 | 0 | 1268.0 | 11.8 | 37.3 | 1189.0 | 1257.8 | 1271.5 | 1285.3 | 1317.0 |
From the Minitab output, the sample mean and sample standard deviation are approximately equals to
(ii)
(a)
The level of significance, null and alternative hypothesis.
Answer to Problem 22P
Solution: The level of significance is
Explanation of Solution
The level of significance is defined as the probability of rejecting the null hypothesis when it is true, it is denoted by
Null hypothesis
Alternative hypothesis
(b)
To find: The sampling distribution that should be used and compute the value of the sample test statistic.
Answer to Problem 22P
Solution: The student’s t distribution should be used. The sample test statistic is -2.71.
Explanation of Solution
Calculation:
We assume that x distribution is mound shape and symmetrical, because
Using
The sample test statistic t is
(c)
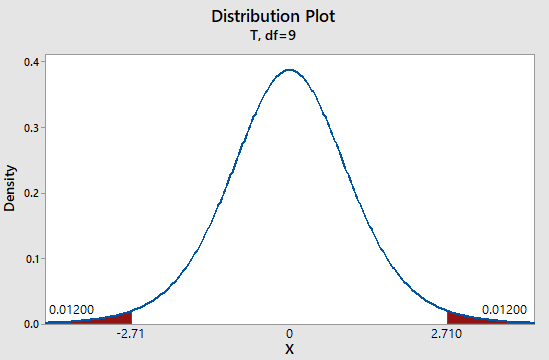
To find: The P-value of the test statistic and sketch the sampling distribution showing the area corresponding to the P-value.
Answer to Problem 22P
Solution: The P-value of the test statistic is 0.024.
Explanation of Solution
Calculation:
We have t = -2.71
Using Table 4 from the Appendix to find the specified area:
Graph:
To draw the required graphs using the Minitab, follow the below instructions:
Step 1: Go to the Minitab software.
Step 2: Go to Graph > Probability distribution plot > View probability.
Step 3: Select ‘t’ and enter d.f = 9.
Step 4: Click on the Shaded area >X value.
Step 5: Enter X-value as -2.71 and select ‘Both Tail’.
Step 6: Click on OK.
The obtained distribution graph is:
(d)
Whether we reject or fail to reject the null hypothesis and whether the data is statistically significant for a level of significance of 0.01.
Answer to Problem 22P
Solution: The P-value
Explanation of Solution
The P-value of 0.024 is greater than the level of significance (
) of 0.01. Therefore we don’t have enough evidence to reject the null hypothesis
(e)
The interpretation for the conclusion.
Answer to Problem 22P
Solution: There is not enough evidence to conclude that population mean of tree ring dates in the area is different from that in 1300 A.D.
Explanation of Solution
The P-value of 0.024 is greater than the level of significance (
) of 0.01. Therefore we don’t have enough evidence to reject the null hypothesis
Want to see more full solutions like this?
Chapter 9 Solutions
Understanding Basic Statistics


- please find the answers for the yellows boxes using the information and the picture belowarrow_forwardA marketing agency wants to determine whether different advertising platforms generate significantly different levels of customer engagement. The agency measures the average number of daily clicks on ads for three platforms: Social Media, Search Engines, and Email Campaigns. The agency collects data on daily clicks for each platform over a 10-day period and wants to test whether there is a statistically significant difference in the mean number of daily clicks among these platforms. Conduct ANOVA test. You can provide your answer by inserting a text box and the answer must include: also please provide a step by on getting the answers in excel Null hypothesis, Alternative hypothesis, Show answer (output table/summary table), and Conclusion based on the P value.arrow_forwardA company found that the daily sales revenue of its flagship product follows a normal distribution with a mean of $4500 and a standard deviation of $450. The company defines a "high-sales day" that is, any day with sales exceeding $4800. please provide a step by step on how to get the answers Q: What percentage of days can the company expect to have "high-sales days" or sales greater than $4800? Q: What is the sales revenue threshold for the bottom 10% of days? (please note that 10% refers to the probability/area under bell curve towards the lower tail of bell curve) Provide answers in the yellow cellsarrow_forward
- Business Discussarrow_forwardThe following data represent total ventilation measured in liters of air per minute per square meter of body area for two independent (and randomly chosen) samples. Analyze these data using the appropriate non-parametric hypothesis testarrow_forwardeach column represents before & after measurements on the same individual. Analyze with the appropriate non-parametric hypothesis test for a paired design.arrow_forward
 Glencoe Algebra 1, Student Edition, 9780079039897...AlgebraISBN:9780079039897Author:CarterPublisher:McGraw Hill
 College Algebra (MindTap Course List)AlgebraISBN:9781305652231Author:R. David Gustafson, Jeff HughesPublisher:Cengage Learning
 Holt Mcdougal Larson Pre-algebra: Student Edition...AlgebraISBN:9780547587776Author:HOLT MCDOUGALPublisher:HOLT MCDOUGAL