
Bundle: Introduction to Statistics and Data Analysis, 5th + WebAssign Printed Access Card: Peck/Olsen/Devore. 5th Edition, Single-Term
5th Edition
ISBN: 9781305620711
Author: Roxy Peck, Chris Olsen, Jay L. Devore
Publisher: Cengage Learning
expand_more
expand_more
format_list_bulleted
Concept explainers
Videos
Textbook Question
Chapter 9.1, Problem 8E
A random sample of n = 12 four-year-old red pine trees was selected, and the diameter (in inches) of each tree’s main stem was measured. The resulting observations are given here:
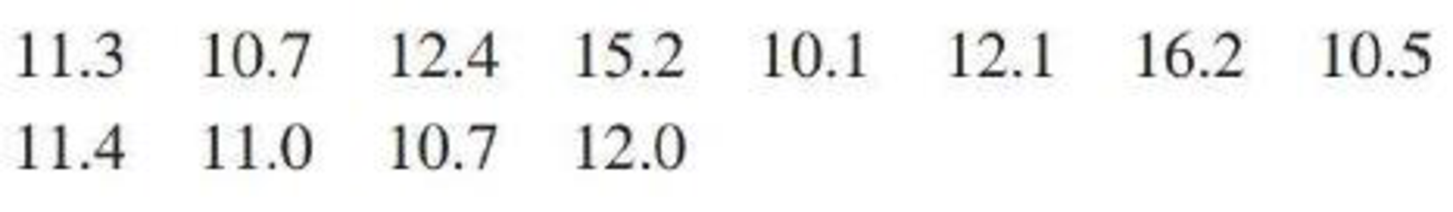
- a. Calculate a point estimate of σ, the population standard deviation of main stem diameter. What statistic did you use to obtain your estimate?
- b. Suppose that the diameter distribution is normal. Then the 90th percentile of the diameter distribution is μ + 1.28σ (so 90% of all trees have diameters less than this value). Calculate a point estimate for this percentile. (Hint: First calculate an estimate of μ and then use it along with your estimate of σ from Part (a).)
Expert Solution & Answer

Trending nowThis is a popular solution!

Students have asked these similar questions
You may need to use the appropriate appendix table or technology to answer this question.
You are given the following information obtained from a random sample of 4 observations.
24
48
31
57
You want to determine whether or not the mean of the population from which this sample was taken is significantly different from 49. (Assume the population is normally distributed.)
(a)
State the null and the alternative hypotheses. (Enter != for ≠ as needed.)
H0:
Ha:
(b)
Determine the test statistic. (Round your answer to three decimal places.)
(c)
Determine the p-value, and at the 5% level of significance, test to determine whether or not the mean of the population is significantly different from 49.
Find the p-value. (Round your answer to four decimal places.)
p-value =
State your conclusion.
Reject H0. There is insufficient evidence to conclude that the mean of the population is different from 49.Do not reject H0. There is sufficient evidence to conclude that the…
65% of all violent felons in the prison system are repeat offenders. If 43 violent felons are randomly selected, find the probability that
a. Exactly 28 of them are repeat offenders.
b. At most 28 of them are repeat offenders. c. At least 28 of them are repeat offenders. d. Between 22 and 26 (including 22 and 26) of them are repeat offenders.
08:34
◄ Classroom
07:59
Probs. 5-32/33
D
ا.
89
5-34. Determine the horizontal and vertical components
of reaction at the pin A and the normal force at the smooth
peg B on the member.
A
0,4 m
0.4 m
Prob. 5-34
F=600 N
fr
th
ar
0.
163586
5-37. The wooden plank resting between the buildings
deflects slightly when it supports the 50-kg boy. This
deflection causes a triangular distribution of load at its ends.
having maximum intensities of w, and wg. Determine w
and wg. each measured in N/m. when the boy is standing
3 m from one end as shown. Neglect the mass of the plank.
0.45 m
3 m
Chapter 9 Solutions
Bundle: Introduction to Statistics and Data Analysis, 5th + WebAssign Printed Access Card: Peck/Olsen/Devore. 5th Edition, Single-Term
Ch. 9.1 - Three different statistics are being considered...Ch. 9.1 - a. Why is an unbiased statistic generally...Ch. 9.1 - Prob. 3ECh. 9.1 - Prob. 4ECh. 9.1 - Each person in a random sample of 20 students at a...Ch. 9.1 - Suppose that each of 935 smokers received a...Ch. 9.1 - Given below are the sodium contents (in mg) for...Ch. 9.1 - A random sample of n = 12 four-year-old red pine...Ch. 9.1 - A random sample of 10 houses heated with natural...Ch. 9.2 - Prob. 10E
Ch. 9.2 - The formula used to calculate a large-sample...Ch. 9.2 - Prob. 12ECh. 9.2 - Discuss how each of the following factors affects...Ch. 9.2 - Prob. 14ECh. 9.2 - Based on data from a survey of 1200 randomly...Ch. 9.2 - Prob. 16ECh. 9.2 - If a hurricane was headed your way, would you...Ch. 9.2 - Prob. 18ECh. 9.2 - Prob. 19ECh. 9.2 - Prob. 20ECh. 9.2 - Prob. 21ECh. 9.2 - Prob. 22ECh. 9.2 - Prob. 23ECh. 9.2 - Prob. 24ECh. 9.2 - Prob. 25ECh. 9.2 - Prob. 26ECh. 9.2 - Prob. 27ECh. 9.2 - The Gallup Organization conducts an annual survey...Ch. 9.2 - The article Hospitals Dispute Medtronic Data on...Ch. 9.2 - Prob. 30ECh. 9.2 - A discussion of digital ethics appears in the...Ch. 9.2 - In spite of the potential safety hazards, some...Ch. 9.2 - Prob. 33ECh. 9.3 - Given a variable that has at distribution with the...Ch. 9.3 - The formula used to calculate a confidence...Ch. 9.3 - USA TODAY reported that the average amount of...Ch. 9.3 - Samples of two different models of cars were...Ch. 9.3 - Prob. 38ECh. 9.3 - In a study of academic procrastination, the...Ch. 9.3 - Medical research has shown that repeated wrist...Ch. 9.3 - Prob. 41ECh. 9.3 - Prob. 42ECh. 9.3 - Suppose that a random sample of 50 bottles of a...Ch. 9.3 - Prob. 44ECh. 9.3 - The article The Association Between Television...Ch. 9.3 - Prob. 46ECh. 9.3 - Because of safety considerations, in May 2003 the...Ch. 9.3 - Example 9.3 gave the following airborne times (in...Ch. 9.3 - Prob. 49ECh. 9.3 - Five students visiting the student health center...Ch. 9.3 - The Bureau of Alcohol, Tobacco, and Firearms...Ch. 9.3 - The formula described in this section for...Ch. 9.4 - The following quote is from the article Credit...Ch. 9.4 - Authors of the news release titled Major Gaps...Ch. 9.4 - The paper The Curious Promiscuity of Queen Honey...Ch. 9 - Prob. 56CRCh. 9 - Prob. 57CRCh. 9 - Prob. 58CRCh. 9 - Prob. 59CRCh. 9 - Prob. 60CRCh. 9 - Prob. 61CRCh. 9 - A manufacturer of small appliances purchases...Ch. 9 - Prob. 63CRCh. 9 - A manufacturer of college textbooks is interested...Ch. 9 - Prob. 65CRCh. 9 - The confidence intervals presented in this chapter...Ch. 9 - Prob. 67CRCh. 9 - The interval from 2.33 to 1.75 captures an area of...Ch. 9 - Prob. 69CR
Knowledge Booster


Learn more about
Need a deep-dive on the concept behind this application? Look no further. Learn more about this topic, statistics and related others by exploring similar questions and additional content below.Similar questions
- Examine the Variables: Carefully review and note the names of all variables in the dataset. Examples of these variables include: Mileage (mpg) Number of Cylinders (cyl) Displacement (disp) Horsepower (hp) Research: Google to understand these variables. Statistical Analysis: Select mpg variable, and perform the following statistical tests. Once you are done with these tests using mpg variable, repeat the same with hp Mean Median First Quartile (Q1) Second Quartile (Q2) Third Quartile (Q3) Fourth Quartile (Q4) 10th Percentile 70th Percentile Skewness Kurtosis Document Your Results: In RStudio: Before running each statistical test, provide a heading in the format shown at the bottom. “# Mean of mileage – Your name’s command” In Microsoft Word: Once you've completed all tests, take a screenshot of your results in RStudio and paste it into a Microsoft Word document. Make sure that snapshots are very clear. You will need multiple snapshots. Also transfer these results to the…arrow_forwardExamine the Variables: Carefully review and note the names of all variables in the dataset. Examples of these variables include: Mileage (mpg) Number of Cylinders (cyl) Displacement (disp) Horsepower (hp) Research: Google to understand these variables. Statistical Analysis: Select mpg variable, and perform the following statistical tests. Once you are done with these tests using mpg variable, repeat the same with hp Mean Median First Quartile (Q1) Second Quartile (Q2) Third Quartile (Q3) Fourth Quartile (Q4) 10th Percentile 70th Percentile Skewness Kurtosis Document Your Results: In RStudio: Before running each statistical test, provide a heading in the format shown at the bottom. “# Mean of mileage – Your name’s command” In Microsoft Word: Once you've completed all tests, take a screenshot of your results in RStudio and paste it into a Microsoft Word document. Make sure that snapshots are very clear. You will need multiple snapshots. Also transfer these results to the…arrow_forwardExamine the Variables: Carefully review and note the names of all variables in the dataset. Examples of these variables include: Mileage (mpg) Number of Cylinders (cyl) Displacement (disp) Horsepower (hp) Research: Google to understand these variables. Statistical Analysis: Select mpg variable, and perform the following statistical tests. Once you are done with these tests using mpg variable, repeat the same with hp Mean Median First Quartile (Q1) Second Quartile (Q2) Third Quartile (Q3) Fourth Quartile (Q4) 10th Percentile 70th Percentile Skewness Kurtosis Document Your Results: In RStudio: Before running each statistical test, provide a heading in the format shown at the bottom. “# Mean of mileage – Your name’s command” In Microsoft Word: Once you've completed all tests, take a screenshot of your results in RStudio and paste it into a Microsoft Word document. Make sure that snapshots are very clear. You will need multiple snapshots. Also transfer these results to the…arrow_forward
- 2 (VaR and ES) Suppose X1 are independent. Prove that ~ Unif[-0.5, 0.5] and X2 VaRa (X1X2) < VaRa(X1) + VaRa (X2). ~ Unif[-0.5, 0.5]arrow_forward8 (Correlation and Diversification) Assume we have two stocks, A and B, show that a particular combination of the two stocks produce a risk-free portfolio when the correlation between the return of A and B is -1.arrow_forward9 (Portfolio allocation) Suppose R₁ and R2 are returns of 2 assets and with expected return and variance respectively r₁ and 72 and variance-covariance σ2, 0%½ and σ12. Find −∞ ≤ w ≤ ∞ such that the portfolio wR₁ + (1 - w) R₂ has the smallest risk.arrow_forward
- 7 (Multivariate random variable) Suppose X, €1, €2, €3 are IID N(0, 1) and Y2 Y₁ = 0.2 0.8X + €1, Y₂ = 0.3 +0.7X+ €2, Y3 = 0.2 + 0.9X + €3. = (In models like this, X is called the common factors of Y₁, Y₂, Y3.) Y = (Y1, Y2, Y3). (a) Find E(Y) and cov(Y). (b) What can you observe from cov(Y). Writearrow_forward1 (VaR and ES) Suppose X ~ f(x) with 1+x, if 0> x > −1 f(x) = 1−x if 1 x > 0 Find VaRo.05 (X) and ES0.05 (X).arrow_forwardJoy is making Christmas gifts. She has 6 1/12 feet of yarn and will need 4 1/4 to complete our project. How much yarn will she have left over compute this solution in two different ways arrow_forward
- Solve for X. Explain each step. 2^2x • 2^-4=8arrow_forwardOne hundred people were surveyed, and one question pertained to their educational background. The results of this question and their genders are given in the following table. Female (F) Male (F′) Total College degree (D) 30 20 50 No college degree (D′) 30 20 50 Total 60 40 100 If a person is selected at random from those surveyed, find the probability of each of the following events.1. The person is female or has a college degree. Answer: equation editor Equation Editor 2. The person is male or does not have a college degree. Answer: equation editor Equation Editor 3. The person is female or does not have a college degree.arrow_forwardneed help with part barrow_forward
arrow_back_ios
SEE MORE QUESTIONS
arrow_forward_ios
Recommended textbooks for you
 Glencoe Algebra 1, Student Edition, 9780079039897...AlgebraISBN:9780079039897Author:CarterPublisher:McGraw Hill
 Big Ideas Math A Bridge To Success Algebra 1: Stu...AlgebraISBN:9781680331141Author:HOUGHTON MIFFLIN HARCOURTPublisher:Houghton Mifflin Harcourt
Glencoe Algebra 1, Student Edition, 9780079039897...
Algebra
ISBN:9780079039897
Author:Carter
Publisher:McGraw Hill
Big Ideas Math A Bridge To Success Algebra 1: Stu...
Algebra
ISBN:9781680331141
Author:HOUGHTON MIFFLIN HARCOURT
Publisher:Houghton Mifflin Harcourt
Statistics 4.1 Point Estimators; Author: Dr. Jack L. Jackson II;https://www.youtube.com/watch?v=2MrI0J8XCEE;License: Standard YouTube License, CC-BY
Statistics 101: Point Estimators; Author: Brandon Foltz;https://www.youtube.com/watch?v=4v41z3HwLaM;License: Standard YouTube License, CC-BY
Central limit theorem; Author: 365 Data Science;https://www.youtube.com/watch?v=b5xQmk9veZ4;License: Standard YouTube License, CC-BY
Point Estimate Definition & Example; Author: Prof. Essa;https://www.youtube.com/watch?v=OTVwtvQmSn0;License: Standard Youtube License
Point Estimation; Author: Vamsidhar Ambatipudi;https://www.youtube.com/watch?v=flqhlM2bZWc;License: Standard Youtube License